

E-commerce isn’t just a trend; it’s a revolution that’s reshaping how we shop, sell, and interact with brands.
With global retail ecommerce sales projected to reach trillions of dollars and over 2.77 billion online shoppers expected by 2025, this digital marketplace is exploding, fueled by convenience, innovation, and a global reach that’s redefining the meaning of “retail therapy.”
Buckle up as we uncover 100+ jaw-dropping e-commerce statistics that reveal the secrets of this booming industry and the trends shaping its future.
General Ecommerce Statistics
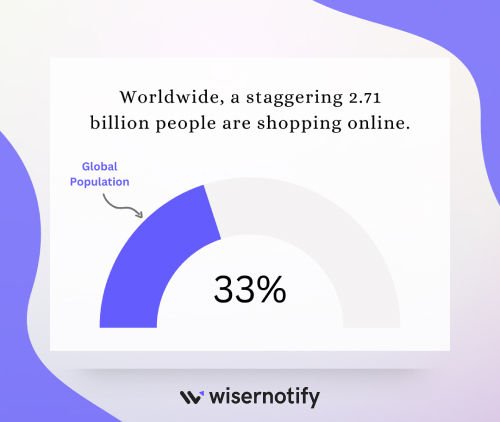
1. Worldwide, a staggering 2.71 billion people are shopping online. That’s a whopping 33% of the global population!
2. Experts predict that 20.1% of total retail sales will happen online in 2024. This figure is only expected to grow, reaching 22.6% by 2027.
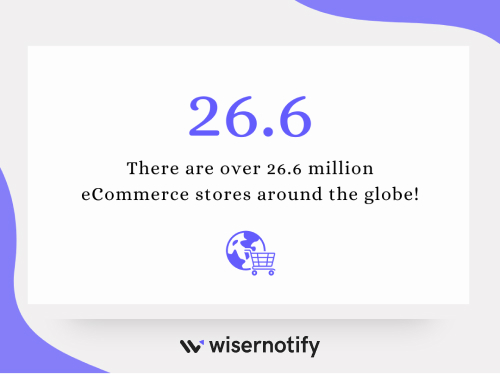
3.“E-Commerce Sites Reach 26.6 Million Globally in 2024”
Global Ecommerce Sales
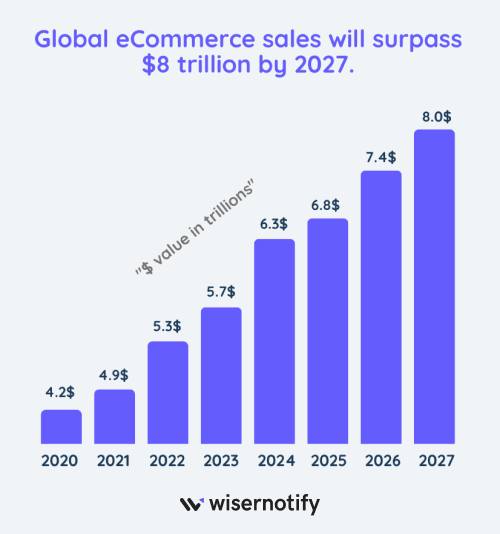
4. Global eCommerce sales are expected to surpass a mind-boggling $8 trillion in 2027.
Mobile shopping is a significant contributor to this growth, with an increasing number of consumers using their smartphones for online purchases.
That’s trillion with a “T”! It’s no wonder that businesses of all sizes are vying for a piece of the eCommerce pie.
5. 52% of online shoppers aren’t afraid to look beyond their borders.
Ecommerce Market Size by Region
6. Asia-Pacific: $3.2 trillion. This region is a powerhouse, with China leading the charge.
7. North America: $1.1 trillion. The US is the major player here, with a mature and diverse eCommerce market.
8. Europe: $948 billion. Western European countries like the UK, Germany, and France are major contributors.
9. Latin America: $118 billion. While smaller, this market is experiencing rapid growth.
10. Middle East & Africa: $66 billion. This region is also growing but still has significant untapped potential.
11. Rest of World: $48 billion. This category includes smaller markets that are gradually embracing eCommerce.
Ecommerce Statistics in Specific Regions
Let’s zoom in and take a closer look at the eCommerce landscape in three key regions: the United States, India, and the United Kingdom.
Ecommerce Statistics in China
12. China is the world’s largest eCommerce market, with sales expected to reach a staggering $2.29 trillion in 2024. That’s more than the US and UK combined!
13. Over 710 million Chinese consumers shop online. That’s a massive audience for online retailers!
14. Mobile commerce (m-commerce) is huge in China, accounting for 79.1% of all eCommerce sales. Chinese consumers are glued to their smartphones!
Ecommerce Statistics in the United States
15. 283 million Americans are expected to shop online in 2024.
16. The US eCommerce market is projected to reach a staggering $1.1 trillion by 2024.
The e-commerce industry is clearly a driving force in the American economy. Social media platforms like Facebook and Instagram significantly impact e-commerce sales in the US.
17. Mobile commerce (m-commerce) is huge in the US, accounting for 50.5% of all eCommerce sales. Americans love shopping on their smartphones!
Ecommerce Statistics in India
18. The Indian eCommerce market is expected to reach $111.4 billion by 2025. That’s a compound annual growth rate (CAGR) of 51%!
19. India has 800 million internet users, making it the second-largest online market in the world.
20. 65% of Indian online shoppers use their smartphones for purchases. Mobile commerce is the way online business has to go in India!
Ecommerce Statistics in the United Kingdom
21. 93% of UK internet users have shopped online. That’s practically everyone!
22. The UK eCommerce market is projected to reach $264 billion by 2024.
23. Mobile commerce accounts for 54% of all eCommerce sales in the UK.
Ecommerce Growth Projections
24. Experts predict that global eCommerce sales will reach a mind-blowing $10 trillion by 2027. That’s more than double the projected sales for 2024.
25. By 2025, a whopping 2.77 billion people are expected to shop online—a huge chunk of the global population!
B2B Ecommerce Statistics
26. Global B2B eCommerce sales are projected to hit a mind-blowing $20.9 trillion by 2027. That’s way more than the B2C market!
27. 70% of B2B decision-makers prefer making purchases online. It’s all about convenience and efficiency.
28. The average B2B order value is significantly higher than B2C, coming in at $491. It’s clear that businesses are willing to spend big online.
B2C Ecommerce Statistics
29. Global B2C eCommerce sales are expected to reach $6.3 trillion in 2024.
30. 57% of online shoppers have purchased products from overseas retailers
31. Social media plays a significant role in B2C eCommerce, with 55% of consumers discovering new products through social channels.
Ecommerce Fraud Statistics
32. Online payment fraud losses are expected to exceed $48 billion per year by 2023. That’s a lot of money lost to scammers!
33. The most common types of eCommerce fraud include credit card fraud, identity theft, and phishing scams.
Read more here: E-Commerce Fraud Statistics: $48 Billion Lost Annually
Ecommerce Marketing Statistics
34. Email marketing remains a top performer, with an average return on investment (ROI) of $42 for every $1 spent.
35. Content marketing is also essential, with 72% of marketers reporting that it improves engagement and leads.
36. Social media advertising is on the rise, with a 25% year-over-year growth in spending.
ECommerce Growth Statistics
37. Ecommerce sales have increased by a whopping 259% since 2014.
38. Mobile commerce (m-commerce) has been a major driver of this growth, with a 500% increase in sales since 2016.
ECommerce Revenue Statistics
39. Amazon, the undisputed king of the global eCommerce landscape, generated a staggering $469.8 billion in revenue in 2022.
40. The top 1% of eCommerce companies account for a whopping 65% of online sales. The global eCommerce market is highly concentrated, with a few major players dominating the scene.
ECommerce Shopping Cart Abandonment
41. The average cart abandonment rate is a whopping 69.80%. That means nearly 7 out of 10 online shopping carts are abandoned!
42. The top reasons for cart abandonment include unexpected shipping costs, a complicated checkout process, and not being ready to buy.
Read more here: Cart Abandonment Statistics: $18 Billion in Annual Losses
ECommerce Shipping Statistics
43. Free shipping is a major draw for online shoppers, with 80% of consumers saying it’s a key factor in their purchasing decisions. Who doesn’t love free shipping?
44. Fast shipping is also important, with 61% of consumers expecting their orders to arrive within 1-3 business days.
45. The average cost of shipping a package in the US is $6.63.
ECommerce Return Rates
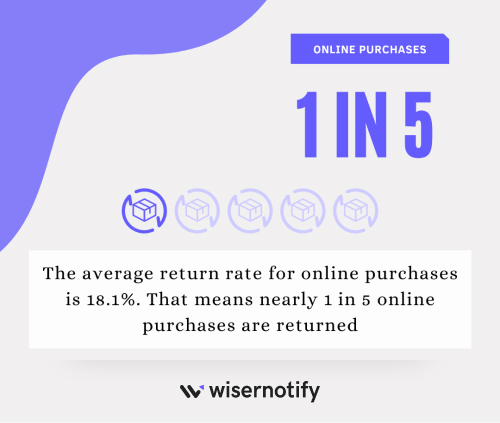
46. The average return rate for online purchases is 18.1%. That means nearly 1 in 5 online purchases are returned.
47. The most common reasons for returns include the item not matching the description, the wrong size or color being ordered, and the item arriving damaged.
ECommerce Conversion Rates Statistics
48. The average eCommerce conversion rate is 2.86%. That means less than 3 out of 100 website visitors make a purchase.
Read more:
49. The top 25% of eCommerce businesses have conversion rates of 5.31% or higher.
50. The conversion rate on mobile devices is lower than on desktops, coming in at 1.81%.
A must-read if you want to boost your conversions: 50 Conversion Rate Optimization Tools (Top Picks)
Ecommerce Shopping Statistics
51. 63% of shopping occasions begin online. That means most of us start our shopping journeys by browsing the web, even if we ultimately buy in a physical store.
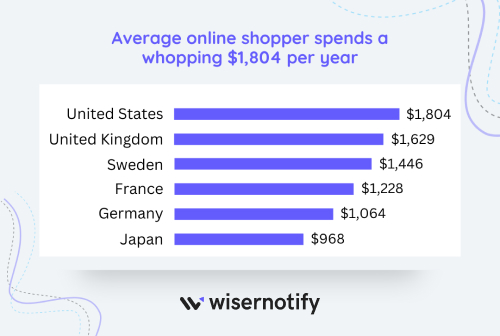
52. The average online shopper spends a whopping $1,804 per year.
53. The most popular product categories for online shopping include fashion, electronics, and beauty products.
Read more here: 80+ Online Shopping Statistics & Trends
Average Order Value Statistics
54. The average order value for online purchases is $162.
55. AOV varies significantly by industry, with luxury goods having the highest AOV and groceries having the lowest.
Must Read: Top 14 Upselling Statistics & Cross-Selling Statistics
Ecommerce Automation Statistics
56. 76% of eCommerce businesses use marketing automation tools.
57. Email automation is a top priority for 64% of marketers.
58. Chatbots are becoming increasingly popular, with 40% of consumers using them for customer service inquiries.
Social Media Ecommerce Statistics
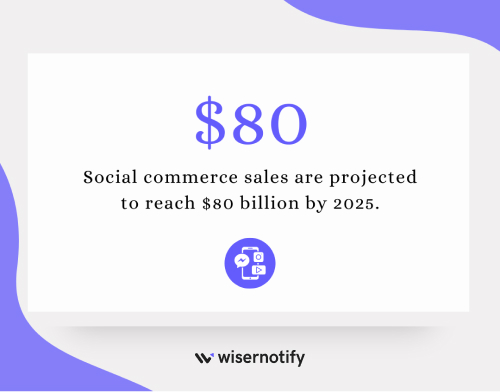
59. Social commerce sales are projected to reach $80 billion by 2025.
60. Facebook is the leading social commerce platform, followed by Instagram and Pinterest.
61. 54% of social browsers use social media to research products.
Mobile Ecommerce Statistics
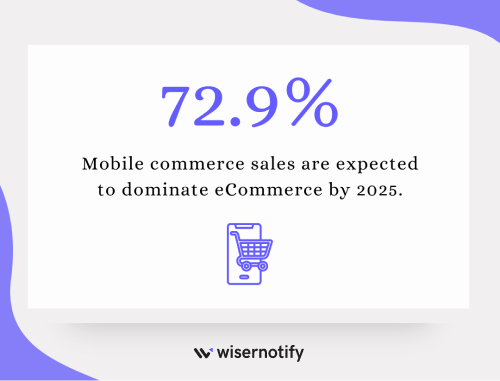
62. Mobile commerce sales are expected to account for 72.9% of all eCommerce sales by 2025.
63. 57% of mobile shoppers will abandon a website if it takes longer than 3 seconds to load.
64. Mobile optimization is crucial for your eCommerce store’s success, with 85% of consumers prefer mobile-friendly websites. Make sure your site is easy to navigate on a small screen!
65. Mobile payments are expected to account for 52% of global eCommerce transaction value by 2024.
Special Days Impact on Ecommerce Sales
Black Friday
66. A whopping $9.12 billion was spent online in the US alone on Black Friday 2023.
67. Mobile devices accounted for 48% of all Black Friday online sales.
68. The average order value on Black Friday was $168.
Read more here: 24 Impactful Black Friday Statistics
Cyber Monday
69. Cyber Monday 2023 raked in a record-breaking $11.3 billion in online sales in the US.
70. 63% of Cyber Monday shoppers used their smartphones to snag those deals.
71. Electronics were the most popular product category on Cyber Monday, followed by apparel and home goods.
Read more here:
Christmas
72. The 2023 holiday season (including Thanksgiving, Black Friday, Cyber Monday, and Christmas) generated a mind-boggling $1.27 trillion in online sales in the US.
73. 64% of holiday shoppers planned to do at least half of their shopping online.
74. The most popular gift categories for Christmas include toys, electronics, and clothing.
Read more here:
Valentine’s Day
75. Americans spent an estimated $25.9 billion on Valentine’s Day in 2023.
76. Online sales accounted for a significant portion of Valentine’s Day spending, with popular gifts including flowers, chocolates, and jewelry.
Read more here:
Chinese New Year
77. Chinese New Year is a major shopping event in China, with eCommerce sales reaching a staggering $136 billion in 2023.
78. Mobile commerce dominates Chinese New Year shopping, with over 80% of sales happening on smartphones.
79. Popular gifts during Chinese New Year include red envelopes (filled with money), clothing, and food.
Halloween
80. Halloween is a surprisingly big shopping event, with Americans spending an estimated $10.6 billion on costumes, candy, and decorations in 2023.
It’s spooky how much we spend on this holiday!
81. Online shopping is becoming increasingly popular for Halloween, with consumers searching for unique costumes and decorations that they can’t find in stores.
Read more here:
Ecommerce Platforms Statistics
82. Amazon: 37.8% market share. The undisputed king of eCommerce, Amazon offers a vast selection of products, competitive prices, and fast shipping.
83. Shopify: 10.3% market share. A popular choice for small and medium-sized online businesses, Shopify provides an easy-to-use platform for building and managing online stores.
84. WooCommerce: 4.4% market share. A free WordPress plugin, WooCommerce allows users to turn their websites into fully functional eCommerce stores.
85. Wix eCommerce: 2.9% market share. A user-friendly website builder, Wix also offers eCommerce capabilities for businesses of all sizes.
86. Squarespace: 2.6% market share. Known for its stylish templates, Squarespace also provides eCommerce functionality for businesses looking to create a visually appealing online store.
ECommerce User Demographics
Age
-
18-24 years old: 27% of online shoppers
-
25-34 years old: 30% of online shoppers
-
35-44 years old: 22% of online shoppers
-
45-54 years old: 14% of online shoppers
-
55-64 years old: 5% of online shoppers
-
65+ years old: 2% of online shoppers
Gender
-
Male: 48% of online shoppers
-
Female: 52% of online shoppers
Income
-
Less than $25,000: 12% of online shoppers
-
$25,000-$49,999: 21% of online shoppers
-
$50,000-$74,999: 25% of online shoppers
-
$75,000-$99,999: 18% of online shoppers
-
$100,000 or more: 24% of online shoppers
Education
-
Less than high school diploma: 5% of online shoppers
-
High school diploma or equivalent: 20% of online shoppers
-
Some college: 25% of online shoppers
-
Bachelor’s degree or higher: 50% of online shoppers
Location
-
Urban: 60% of online shoppers
-
Suburban: 25% of online shoppers
-
Rural: 15% of online shoppers
Device
-
Smartphone: 70% of online shopping traffic
-
Desktop: 25% of online shopping traffic
-
Tablet: 5% of online shopping traffic
Ecommerce personalization statistics
87. 91% of consumers are more likely to shop with brands that provide personalized recommendations.
88. 80% of consumers are more likely to purchase a product or service from a brand that provides personalized experiences.
89. 71% of consumers feel frustrated when a shopping experience is impersonal.
Read more here: 50+ Ecommerce Personalization Statistics & Trends
Personalized Shopping Statistics
90. 91% of consumers are more likely to shop with brands that provide personalized recommendations.
91. 80% of consumers are more likely to purchase from brands that offer personalized experiences.
92. 71% of consumers feel frustrated when a shopping experience is impersonal.
93. 40% more likely for consumers to spend more than planned when they find the shopping experience highly personalized.
94. 74% of eCommerce companies have implemented a website personalization program.
Omnichannel ECommerce Statistics
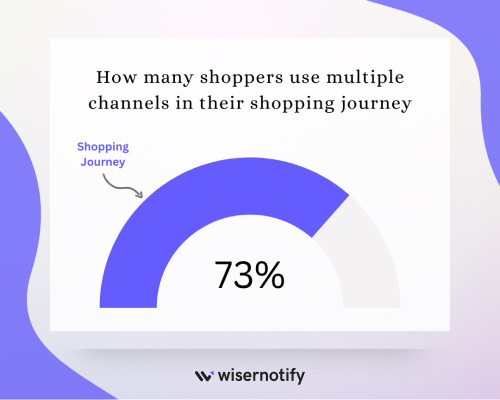
95. 73% of shoppers use multiple channels during their shopping journey.
96. Companies with strong omnichannel customer engagement see a 9.5% year-over-year increase in annual revenue.
97. Omnichannel shoppers have a 30% higher lifetime value than single-channel shoppers.
98. 64% of shoppers expect to receive real-time assistance regardless of the channel they’re using.
99. 87% of retailers agree that an omnichannel strategy for digital buyers is critical or important to their business.
Read more here: 20+ Omnichannel Statistics & Trends
Also check out: 11 Powerful Omnichannel Platforms to Grow Your Business
ECommerce Customer Service Statistics
100. 73% of consumers say customer service experience is more important than price or product features when making a purchase decision.
101. 90% of Americans use customer service as a factor in deciding whether to do business with a company.
102. 93% of customers are likely to make repeat purchases from a brand after a positive customer service interaction.
103. 69% of consumers have stopped doing business with a brand due to a poor customer service experience.
104. 5-25x higher cost to acquire a new customer compared to retaining an existing one, highlighting the importance of good customer service.
ECommerce Trends
Livestream Shopping
- 66% of consumers have purchased a product after watching a livestream shopping event.
- Livestream shopping events can increase conversion rates by up to 30%.
- 70% of consumers who have watched a livestream shopping event say they are likely to do so again.
Augmented Reality (AR) and Virtual Reality (VR)
- 71% of consumers say they would shop more often if they could use AR.
- 61% of consumers prefer retailers with AR experiences.
- 40% of consumers are willing to pay more for a product if they can experience it through AR.
Sustainable Ecommerce
- 66% of global consumers are willing to pay more for sustainable brands.
- 73% of millennials are willing to pay more for sustainable products.
- 50% of consumers have switched to a different brand because of its sustainability practices.
Ecommerce Payment Trends
Digital Wallets
Projected global usage by 2025: $10 trillion
Percentage of online shoppers who’ve used digital wallets: 55%
Buy Now, Pay Later (BNPL):
Projected market size by 2025: $680 billion
Percentage of consumers who’ve used BNPL services online: 60%
Wrap up
Data is the lifeblood of ecommerce. It informs strategies, drives decisions, and ultimately determines who thrives and who struggles in this competitive arena.
The 100+ global ecommerce statistics we’ve explored provide a wealth of data-driven insights into the ecommerce world, shedding light on the trends that are shaping its future.
Sources
