
34 Ecommerce Fraud Statistics for 2026 (Losses, Chargebacks)
Most online stores think of fraud as the odd stolen card that slips through. The bigger cost now comes from real customers who claim a parcel never arrived, and from bots that hammer the checkout all day.
These 34 numbers show what fraud costs a store in 2026, which attacks are most common, how chargebacks and bots are changing, and where fraud checks start turning away good customers.
Use them to size the problem for your own store and decide where a fix pays off first.

Boost Conversion Instantly
Add Social Proof & Urgency to your website
Key Ecommerce Fraud Statistics
| Metric | Latest figure |
|---|---|
| Share of ecommerce revenue lost to payment fraud | 3.5% |
| Share of accepted orders that turn out fraudulent | 3.5% |
| Cost to US merchants for every $1 of fraud | $4.61 |
| Most common attack on online stores | Refund and policy abuse, 41% of merchants |
| Global chargebacks, 2025 to 2028 | 261 million to 324 million |
| Average cost to resolve one friendly fraud dispute | $82 |
| Share of web traffic from bad bots | 40% |
| Fraud losses reported by US consumers in 2025 | $15.9 billion |
How Much Does Ecommerce Fraud Cost?
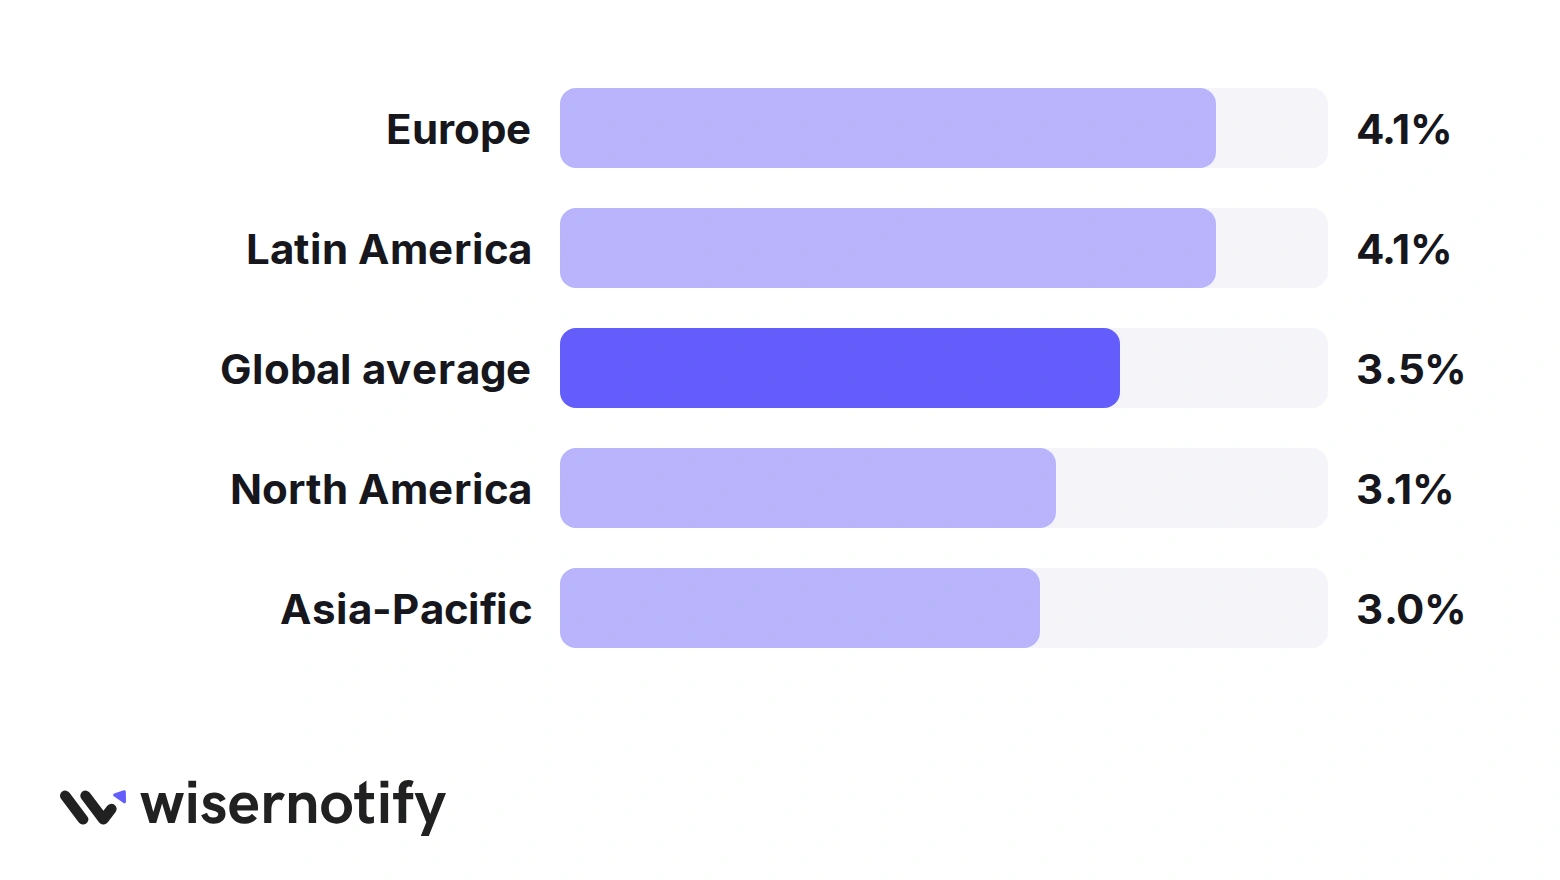
The average online merchant now loses 3.5% of ecommerce revenue to payment fraud, and the true cost per fraudulent dollar is more than four times the order value.
1. Merchants lose an average of 3.5% of their ecommerce revenue to payment fraud, up from 3.2% a year earlier.
2. 3.5% of accepted online orders later turn out to be fraudulent, up from 3.0%.
3. Europe and Latin America lose the most, at 4.1% of revenue each, against 3.1% in North America and 3.0% in Asia-Pacific.
4. Mid-market merchants lose 4.5% of revenue, more than small businesses at 3.4% or enterprises at 3.2%.
5. Every $1 of fraud costs US merchants $4.61 once fines, fees, staff time and replacement goods are added. In Canada it’s $4.52.
6. For US ecommerce merchants, 53% of fraud costs come from online purchases and 30% from mobile.
7. Ecommerce fraud worldwide is forecast to grow from $44 billion in 2024 to $107 billion in 2029.
The order value is the smallest part of the bill. Chargeback fees, staff time and the replacement you ship to the real customer are what turn a $50 fraud into a $230 one.
For the wider market picture, see these ecommerce stats and trends.
Which Fraud Attacks Hit Online Stores Most?
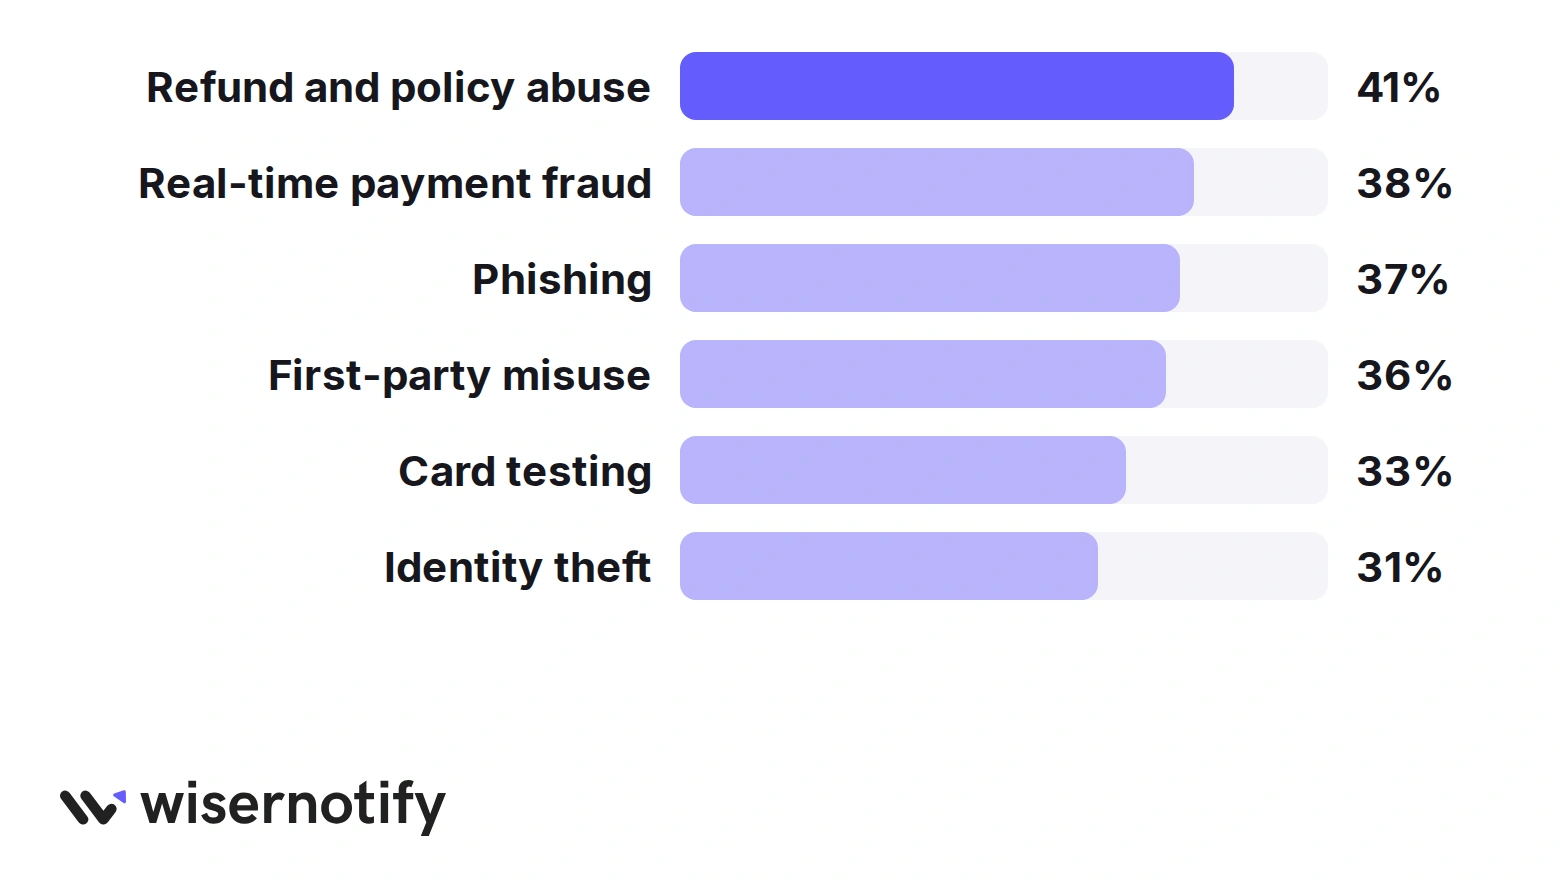
Refund and policy abuse is now the most common attack, and it comes from customers using your own return and delivery rules against you.
8. 98% of merchants faced at least one type of fraud attack in the past year.
9. Refund and policy abuse is the most common attack, reported by 41% of merchants.
10. Real-time payment fraud (38%), phishing (37%), first-party misuse (36%) and card testing (33%) complete the top five.
11. 61% of merchants saw refund and policy abuse increase, and 20% saw it jump by 25% or more.
12. False claims that an order never arrived are the most common form of refund abuse, named by 52% of merchants.
13. The average merchant faced 3.8 different types of attack, down from 4.2, and coupon abuse fell from 32% of merchants to 25%.
Delivery proof is your best defense here. Signature or photo confirmation on higher-value orders shuts down most “never arrived” claims before they reach a dispute.
How Big Are Chargebacks and Friendly Fraud?
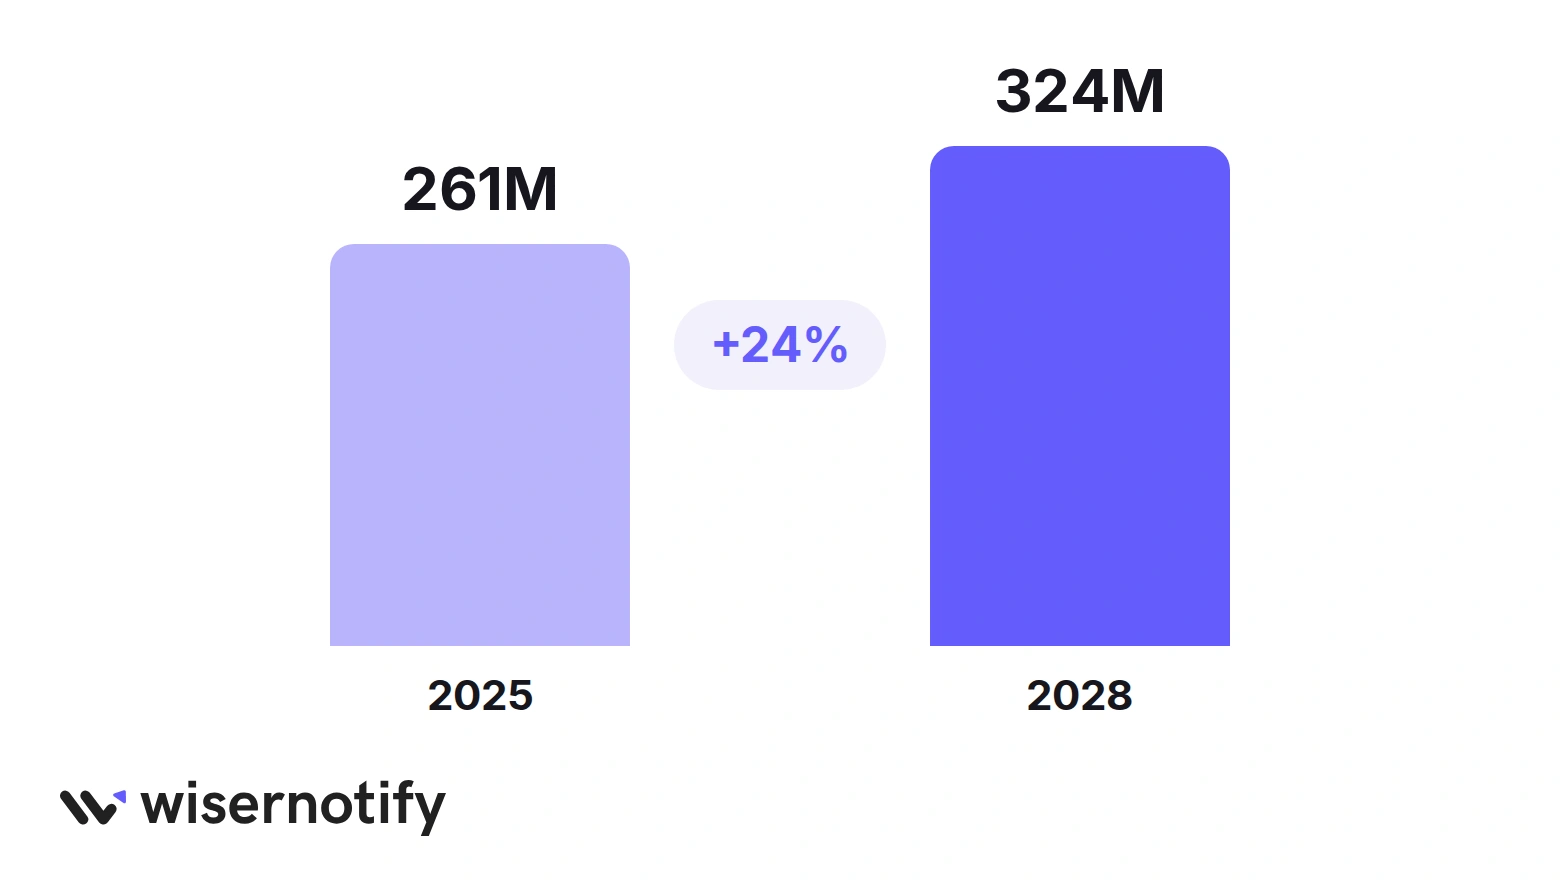
Chargebacks are climbing toward 324 million a year, and merchants win fewer than one in five fraud disputes they fight.
14. Global chargeback volume is forecast to rise from 261 million in 2025 to 324 million in 2028, a 24% increase.
15. About 45% of the chargebacks merchants receive are fraud, either a stolen card or a real customer disputing a real purchase.
16. 64% of merchants report rising first-party misuse, and a quarter saw it climb by 25% or more.
17. Resolving one first-party misuse dispute now costs $82 on average, the first time it has passed $80.
18. Merchants win 16.7% of the fraud chargebacks they contest, from 19.8% in North America down to 12.2% in Latin America.
19. Online retailers now challenge 35% of disputes and win 55% of the ones they fight, up from 47% a year earlier.
A clear billing name, quick replies to “where is my order” emails and an easy refund path stop many disputes before the customer calls their bank. Those same checkout worries also drive cart abandonment.
Build trust & FOMO
Highlight real-time activities like reviews, sales & sign-ups.


How Are Bots and AI Changing Fraud?
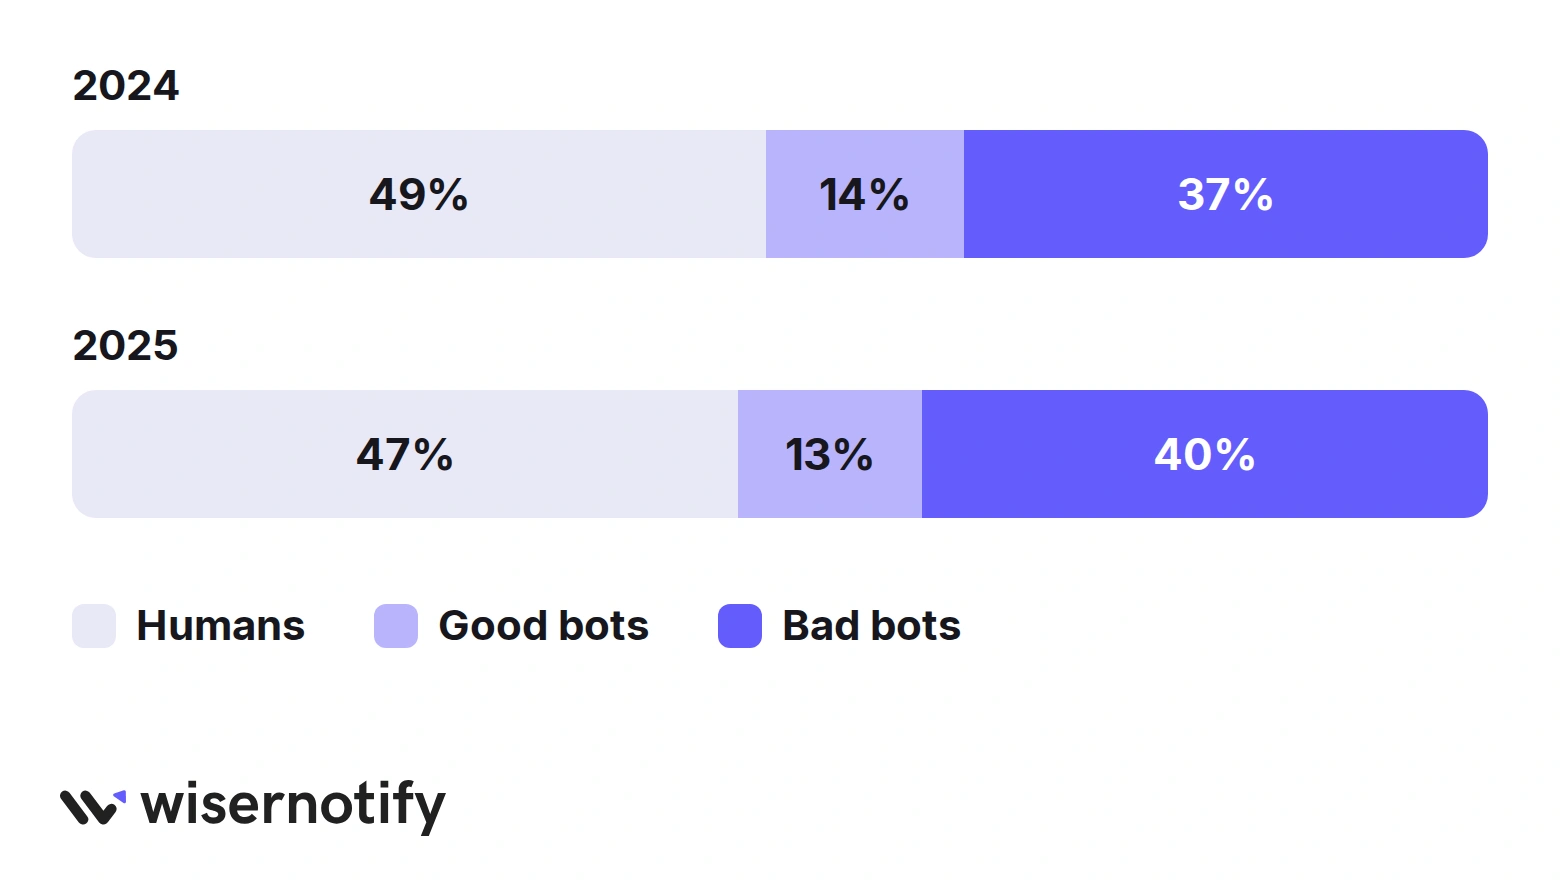
Bots now make up more than half of all web traffic, and AI has made bot attacks cheaper and harder to tell apart from shoppers.
20. Bots made up 53% of all web traffic in 2025, up from 51%, leaving humans with 47%.
21. Bad bots alone account for 40% of web traffic, three points more than the year before.
22. AI-driven bot attacks grew 12.5 times in 2025.
23. Retail sites take 20% of all AI bot attacks.
24. 63% of merchants are planning for payments made by AI shopping agents, and 19% can already accept them.
Card testing, fake account signups and coupon scraping are all bot work. Rate limits on checkout and signup forms cut most of it without touching real shoppers.
When Do Fraud Checks Turn Away Good Customers?
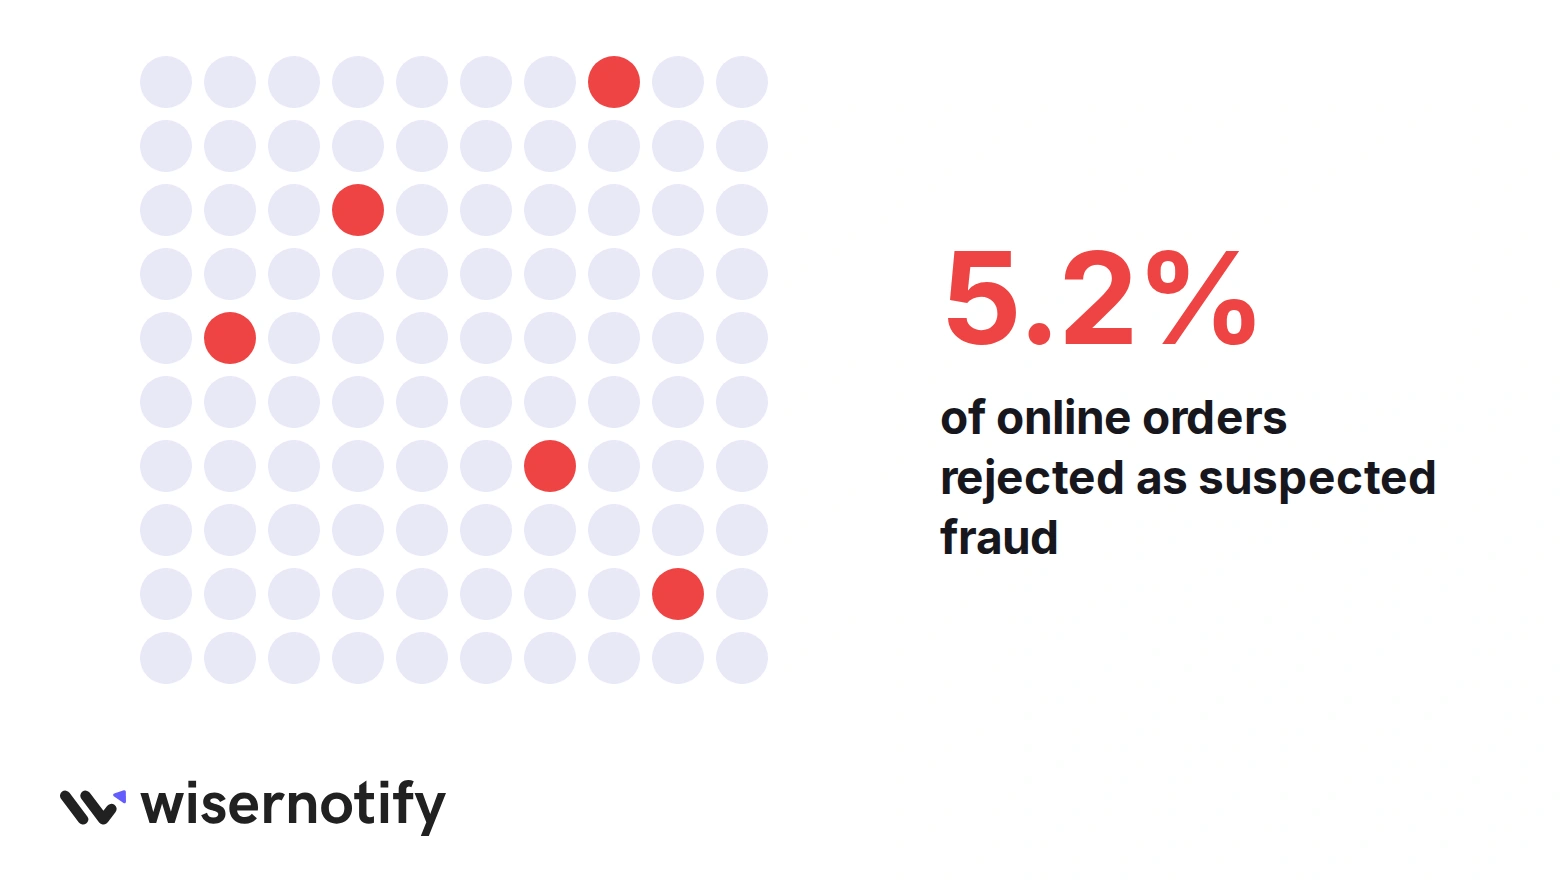
Merchants reject about one in twenty orders as suspected fraud, and many of those are real customers.
25. Merchants reject 5.2% of online orders on suspicion of fraud, and 65% put their false positive rate between 2% and 10%.
26. 41% of North American merchants still rely on manual processes to stop fraud, and in US ecommerce, poor user experience is the top reason shoppers abandon account signup.
A declined good order costs you the sale and usually the customer. Visible proof that real people buy from you, like verified reviews and trust badges, helps a shopper finish checkout after a security step slows them down.
How Much Do Shoppers Lose to Fraud?
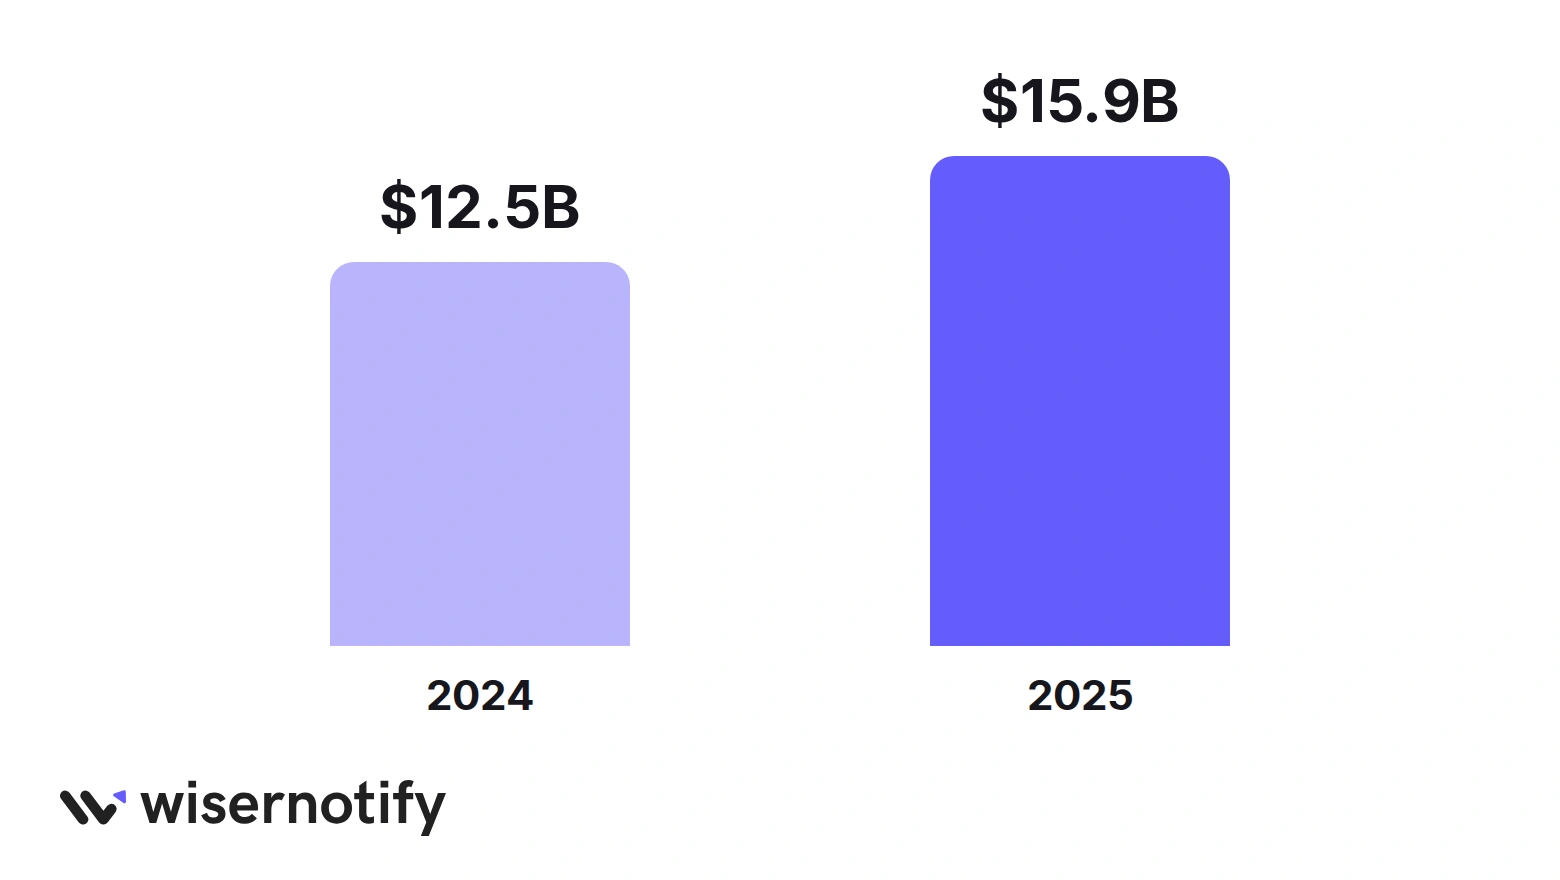
US consumers reported losing a record $15.9 billion to fraud in 2025, which makes shoppers more cautious about every unfamiliar store.
27. US consumers filed 3 million fraud reports in 2025 and reported $15.9 billion in losses, up from 2.6 million reports and $12.5 billion the year before.
That caution lands on honest stores too. Shoppers who have been scammed once check for reviews, real contact details and a clear returns policy before they buy, and fake reviews make that harder, as these fake review statistics show.
How Does Fraud Hurt Trust and Growth?
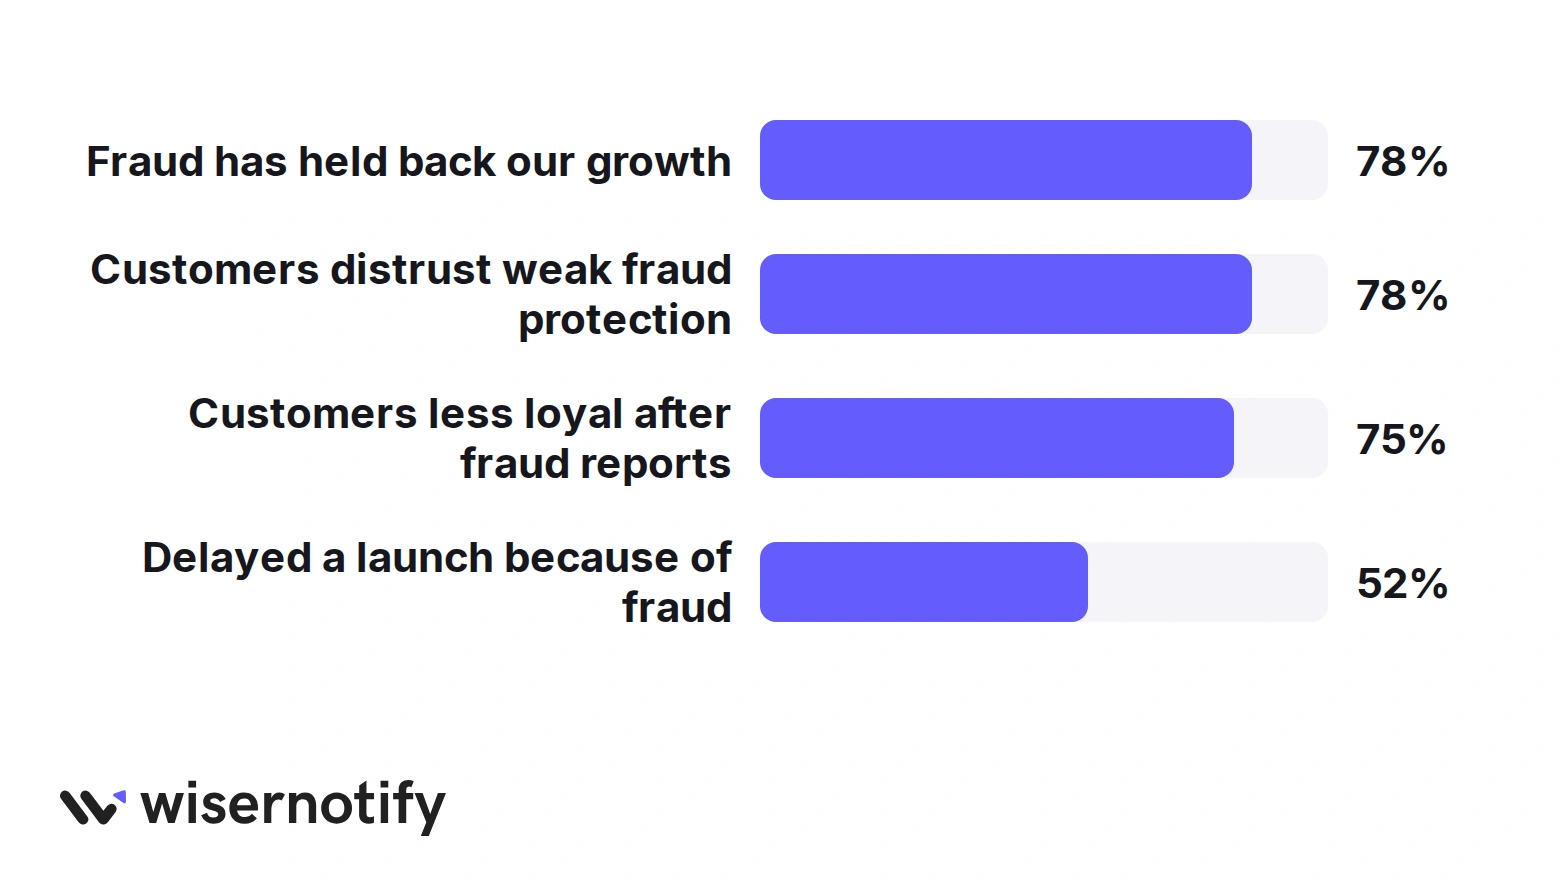
Nearly four in five online retailers say fraud has slowed their growth, and just as many say customers walk away from stores that look weak on it.
28. 78% of online retailers say fraud has held back their company’s growth, and 52% have delayed a product launch or new market because of it.
29. 78% agree that customers don’t trust companies seen as weak on fraud protection, and 75% say customers become less loyal after reports of fraud.
30. 65% feel pressured to refund customers even with evidence of a false claim, and 58% struggle to tell a genuine claim from a false one.
31. 67% of retailers rank customer loyalty and brand reputation above stopping refund abuse.
Shoppers judge your fraud protection by what they can see. Real reviews, a clear returns page and recent-order activity on the site do that job quietly, and these social proof statistics show how much that visibility moves buyers.
How Are Merchants Fighting Back?
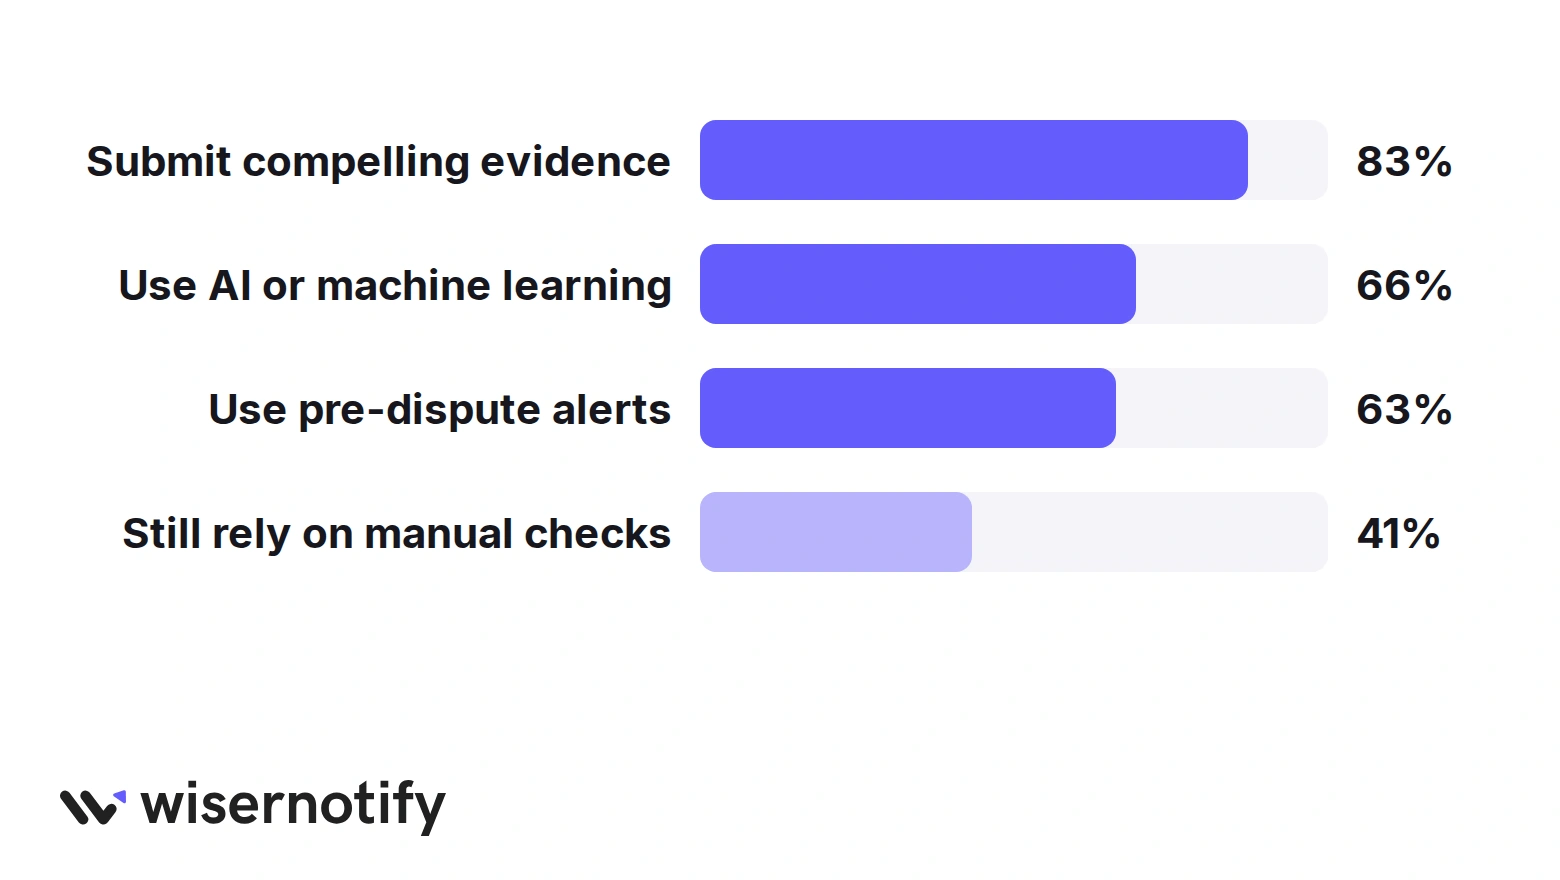
Most merchants now fight disputes with evidence and software, but a large minority still screens orders by hand.
32. 83% of merchants submit compelling evidence, such as delivery and account data, to fight friendly fraud disputes.
33. 66% of online retailers use machine learning or other AI to detect fraud, and 63% use pre-dispute alerts to refund before a chargeback lands.
34. The share of orders screened by hand has fallen from 25% to 21%, while digital screening has grown to 54% of orders.
Start with the cheapest layer. Delivery confirmation, order history checks and an alert that lets you refund before a dispute cost far less than a fraud platform, and they cover most friendly fraud.
Boost Conversion Instantly
Add Social Proof & Urgency to your website
Wrap Up
Fraud has moved from stolen cards to abused policies and automated traffic. The stores that lose least treat it as a running cost to manage, not a rare event.
Tighten delivery proof and refund rules, slow the bots down, and check how many good orders your fraud rules turn away.
Sources
Merchant Risk Council, Visa Acceptance Solutions and Verifi, 2026 Global eCommerce Payments and Fraud Report
LexisNexis Risk Solutions, 2025 True Cost of Fraud Study: Ecommerce and Retail
Juniper Research, Global Merchant Fraud Prevention Market 2024-2029
Mastercard and Datos Insights, 2025 State of Chargebacks
Thales, 2026 Bad Bot Report
Federal Trade Commission, Consumer Sentinel Network 2025 data
Ravelin, Online Retail Fraud Trends 2026
Frequently Asked Questions
What percentage of ecommerce revenue is lost to fraud?
Online merchants lose about 3.5% of their ecommerce revenue to payment fraud on average.
What is the most common type of ecommerce fraud?
Refund and policy abuse, such as false claims that an order never arrived, is now the most common attack on online stores.
What is friendly fraud?
Friendly fraud is when a real customer disputes a purchase they made and received, usually through their bank. It is also called first-party misuse.
How much does a chargeback cost a merchant?
On top of the lost order, resolving one friendly fraud dispute costs merchants about $82 in staff time and fees.
How can a small store reduce ecommerce fraud?
Add delivery confirmation on higher-value orders, rate limits on checkout and clear refund rules, then check how many real orders your filters decline.

Krunal Vaghasiya is a marketing tech expert who boosts e-commerce conversion rates with automated social proof and FOMO strategies. He loves to keep posting insightful posts on online marketing software, marketing automations, and improving conversion rates.




 Capterra