
55 Customer Experience Statistics & Trends (2026)
Customer experience is the quiet reason money moves. People rarely announce why they left a brand. They just stop buying, and the revenue chart shows it months later.
The strange part about 2026 is that the stakes and the performance are moving in opposite directions. Buyers say they will pay more for a good experience than ever, yet measured experience quality across brands has fallen to record lows.
I collected the numbers that explain both sides: what customers expect now, what good and bad experiences do to revenue, and how AI is rewriting the service playbook.
Every figure comes from current research by Qualtrics, PwC, Forrester, Zendesk, McKinsey, and other primary sources.

Boost Conversion Instantly
Add Social Proof & Urgency to your website
Key Customer Experience Statistics
Ten numbers that sum up customer experience in 2026. Figures are current as of July 2026, based on the latest published research from each source.
| Metric | Latest Figure |
|---|---|
| Sales at risk globally from poor experiences | $3.7 trillion |
| Buyers who pay more for a great experience | 86% |
| Customers who leave after one bad experience | 32% (59% after several) |
| Businesses competing mainly on experience | 89% |
| Revenue growth gap, CX leaders vs laggards | 6x |
| Service interactions happening in chat | 45% |
| Service cases AI is expected to resolve by 2027 | 50% |
| Consumers who expect personalized interactions | 76% |
| CX management market size (2026) | $16 to $26 billion |
| Omnichannel retention advantage | 89% vs 33% |
Customer Experience Statistics
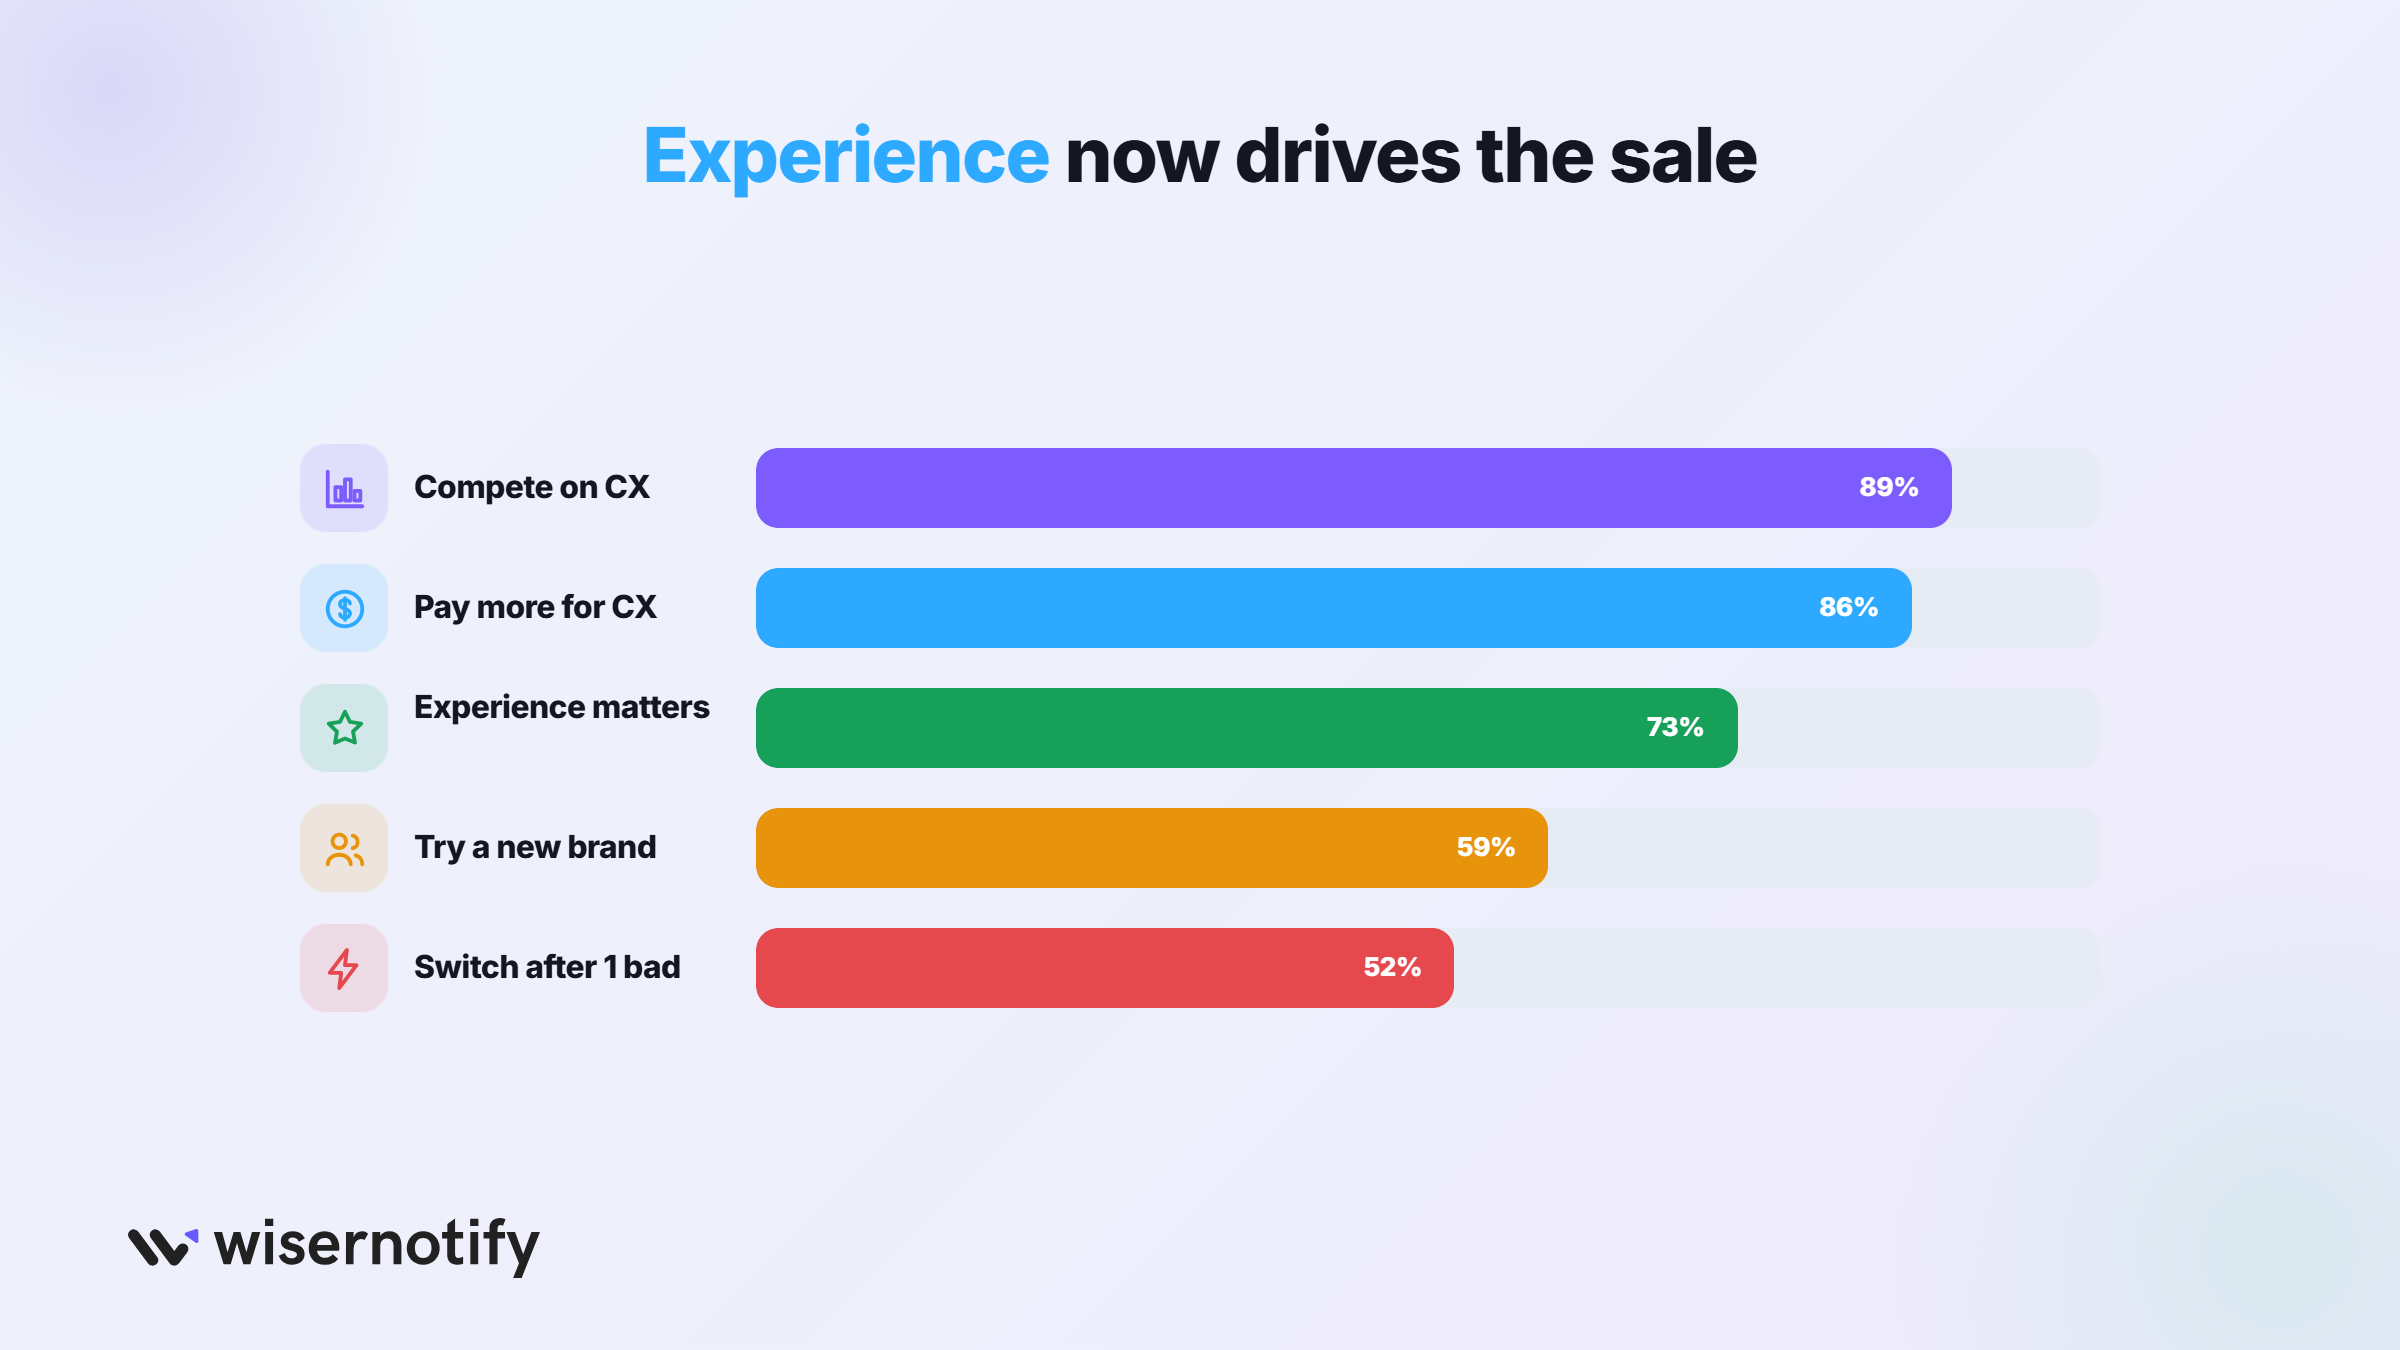
The headline story of 2026: customers value experience more than ever, and most brands are getting worse at delivering it.
1. 86% of buyers are willing to pay more for a great customer experience.
2. 73% of consumers say experience is an important factor in their purchase decisions, ranking it near price and product quality.
3. 89% of businesses now compete primarily on customer experience rather than product or price.
4. Here’s the paradox: US customer experience quality fell to an all-time low in 2024, with 39% of brands declining year over year.
5. 52% of customers will switch to a competitor after a single negative impression.
6. 59% of US customers will try a new brand just to get a better experience.
7. Fewer than 1 in 3 consumers now give feedback after an experience, so most unhappy customers disappear without a word.
Everyone claims to compete on experience while measured quality keeps slipping.
That gap is the opportunity: the bar is lower than the ambition. Word of mouth follows the same math, as these word of mouth marketing statistics show.
Boost Conversion Instantly
Add Social Proof & Urgency to your website
Customer Experience Gap Statistics
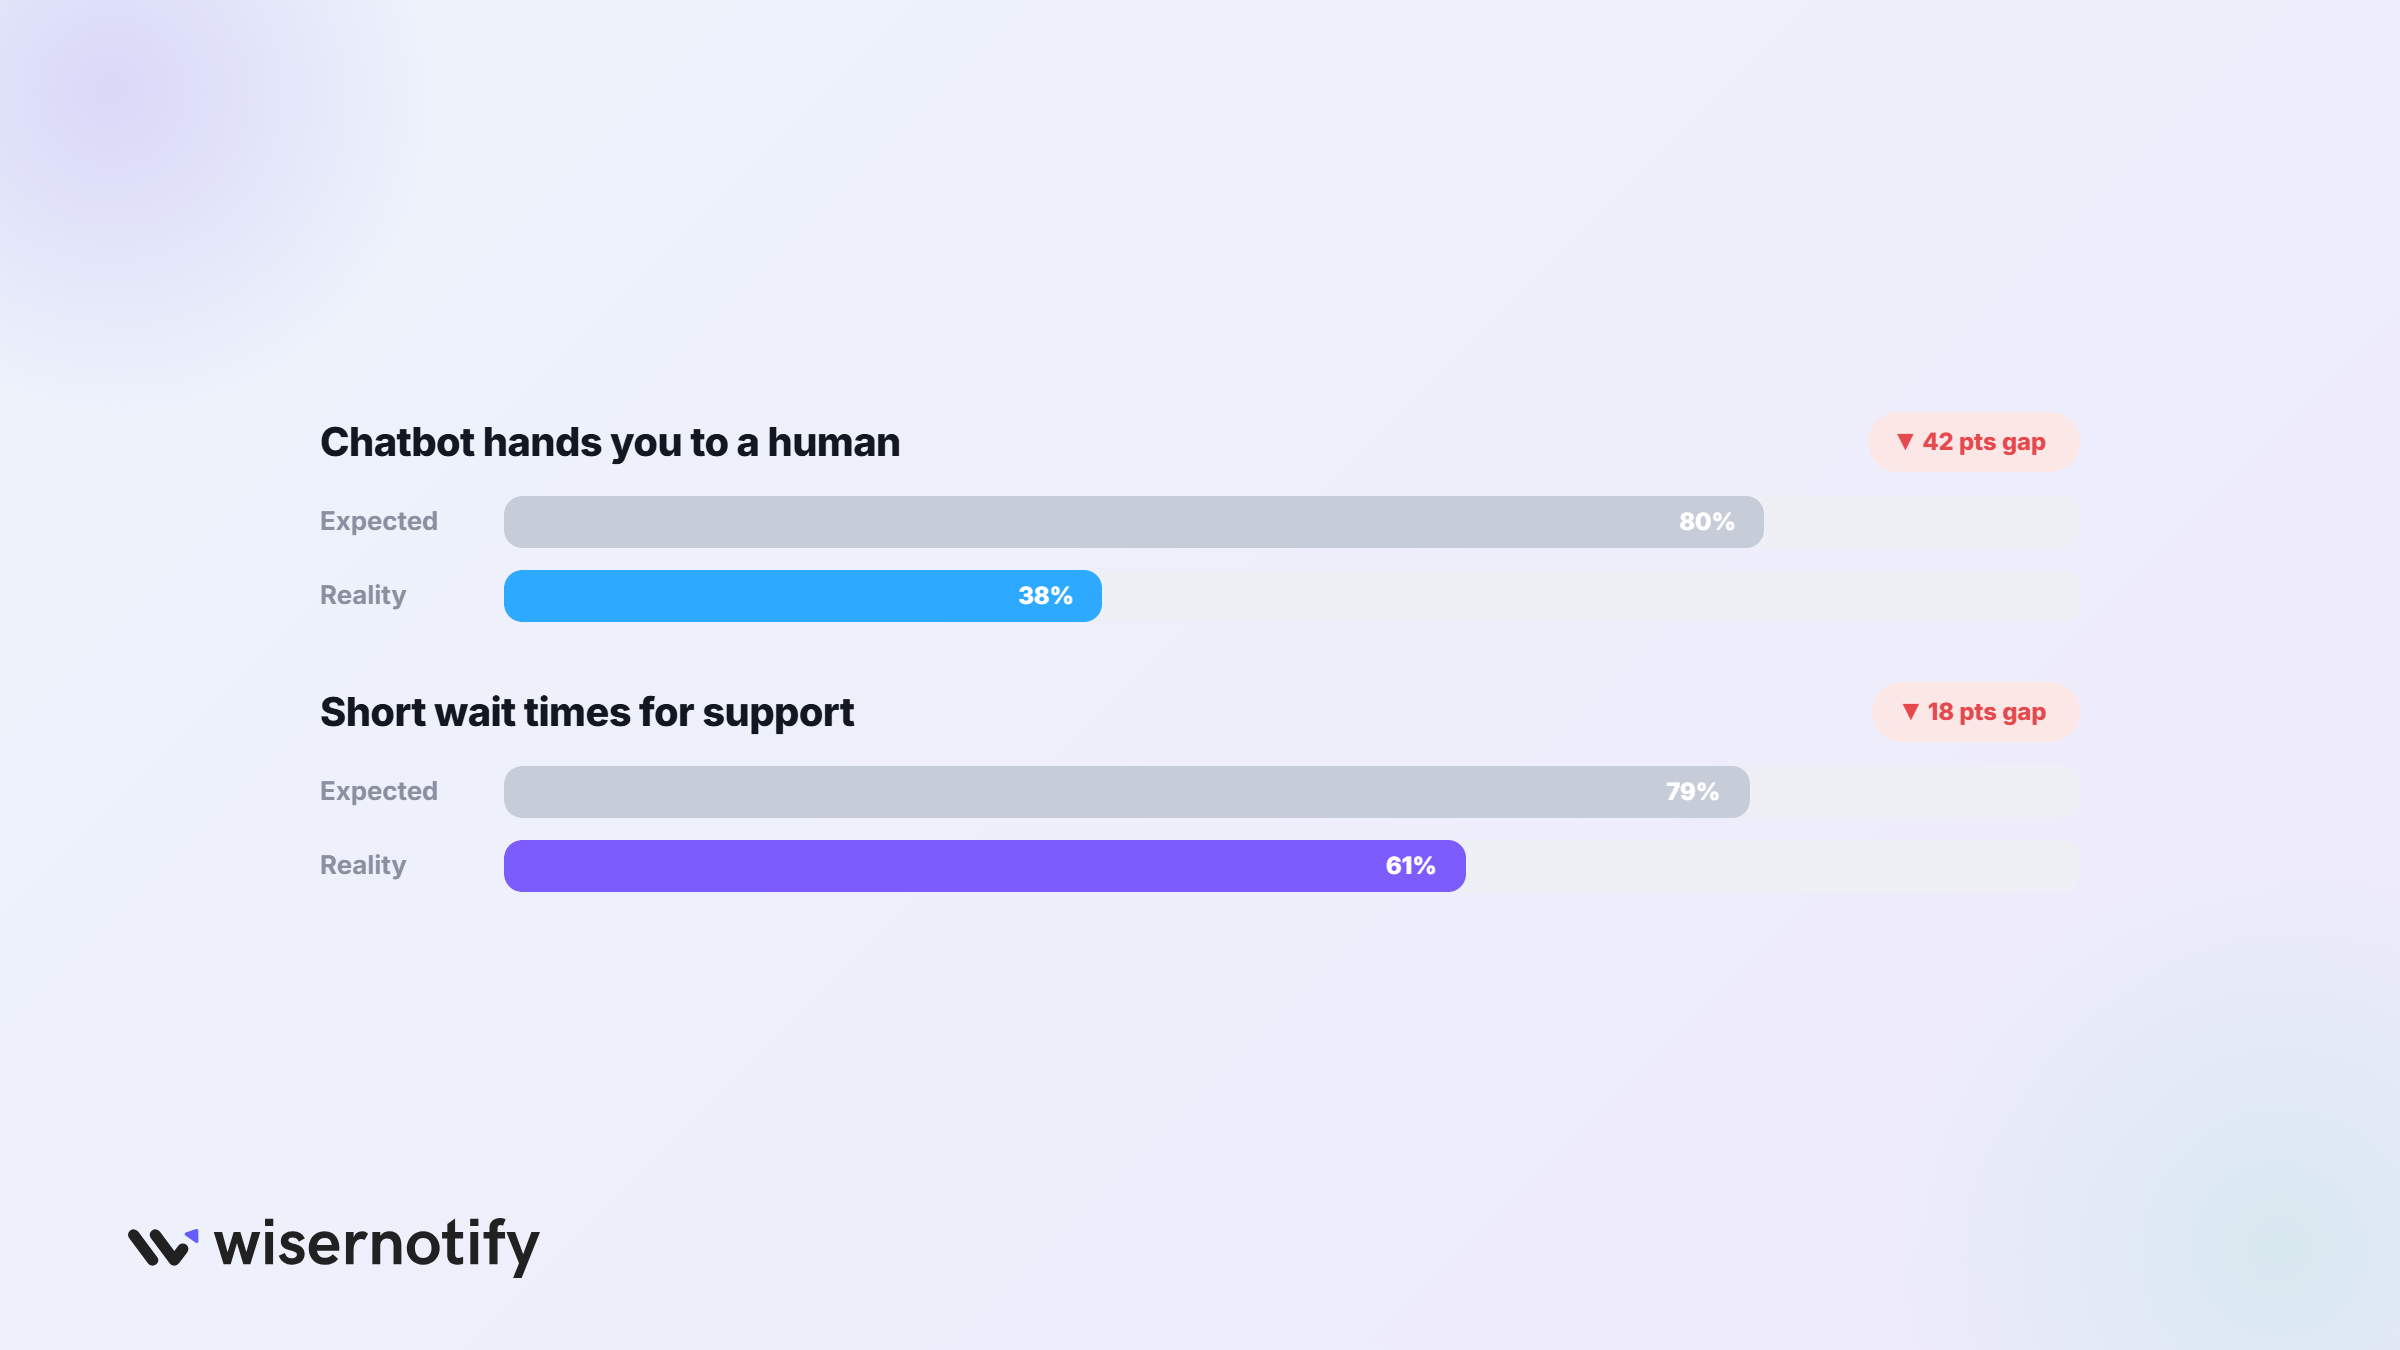
The gap between what companies believe they deliver and what customers actually get shows up in every study.
8. Only 1 in 26 unhappy customers complains directly. The other 25 leave silently.
9. Over 80% of customers expect a chatbot to hand them to a human when it gets stuck, but only 38% say that actually happens.
10. 79% of consumers say short wait times are a basic part of good support, yet only 61% experience them.
11. The top chatbot frustrations: failing to resolve the issue (43%), getting stuck in a loop (38%), and having to repeat information (37%).
12. 75% of consumers say poor customer service changes what and where they buy.
Silent churn is the expensive kind. Most brands never hear the complaint, they just see the revenue dip.
Public reviews are one of the few places the silent majority speaks, which is why these online review statistics matter to experience teams.
The Business Impact of Customer Experience
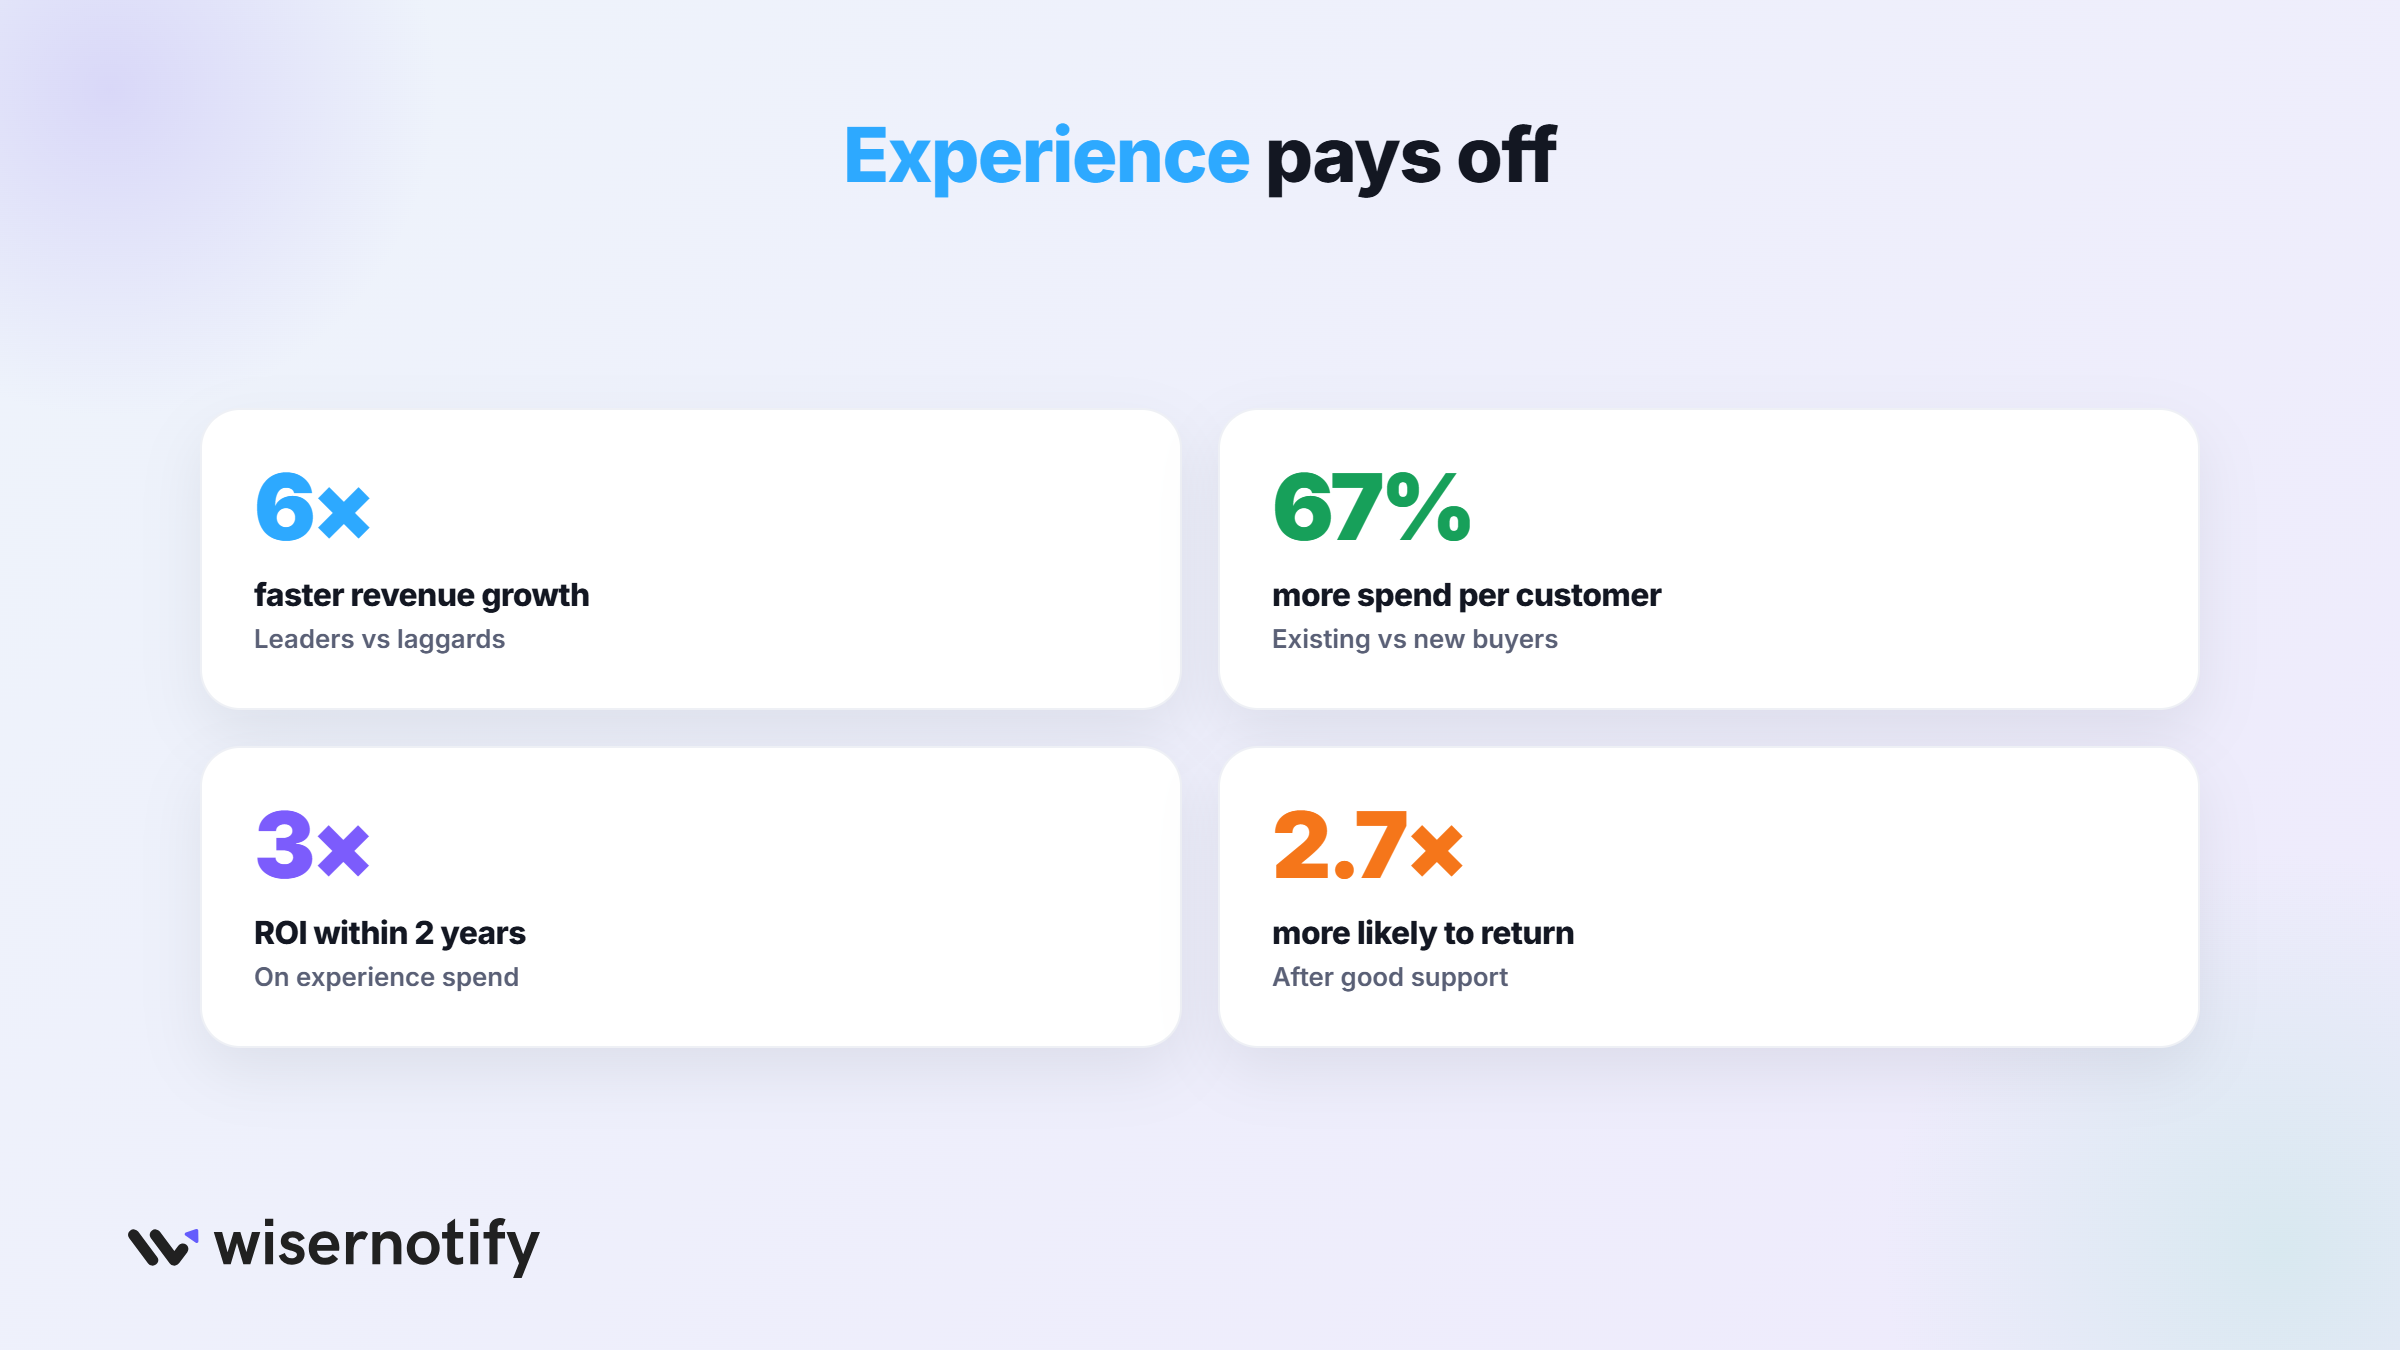
Experience quality shows up directly in growth, retention, and how much each customer spends.
13. Top-quartile experience leaders grow revenue about 6 times faster than bottom-quartile brands.
14. 41% of customer-obsessed companies hit at least 10% revenue growth last fiscal year, compared with just 10% of less mature companies.
15. Companies that actively measure experience ROI are 94% more likely to achieve above-average growth.
16. A 5% improvement in retention lifts profits anywhere from 25% to 95%.
17. Existing customers spend about 67% more on average than new ones.
18. 52% of consumers have made an additional purchase after a single positive experience.
19. Customers are 2.7 times more likely to return after a positive digital support experience.
20. The two biggest purchase drivers today: product quality at 61% and customer service at 47%, ahead of price for many buyers.
21. The typical experience investment returns about 3 times its cost within two years.
Retention is where experience pays.
Keeping a buyer costs less than winning one, and loyal customers are worth multiples over time, as these customer lifetime value examples and average order value tactics break down.
Boost Conversion Instantly
Add Social Proof & Urgency to your website
The Cost of Bad Customer Experience
Bad experiences carry a price tag, and it’s measured in trillions.
22. Poor customer experiences put about $3.7 trillion in sales at risk globally every year.
23. After a negative experience, 34% of consumers reduce their spending with that brand and 13% cut it off entirely.
24. 32% of customers will walk away from a brand they love after just one bad experience.
25. 59% will leave after several bad experiences, no matter how strong the relationship was.
26. 52% of consumers stopped buying from a brand in the past year because of a bad product or service experience.
One bad interaction rarely shows up in a dashboard, but a third of customers are one mistake away from leaving.
Reviews amplify the damage, as this data on the impact of reviews on purchasing decisions shows.
Personalization and Customer Experience
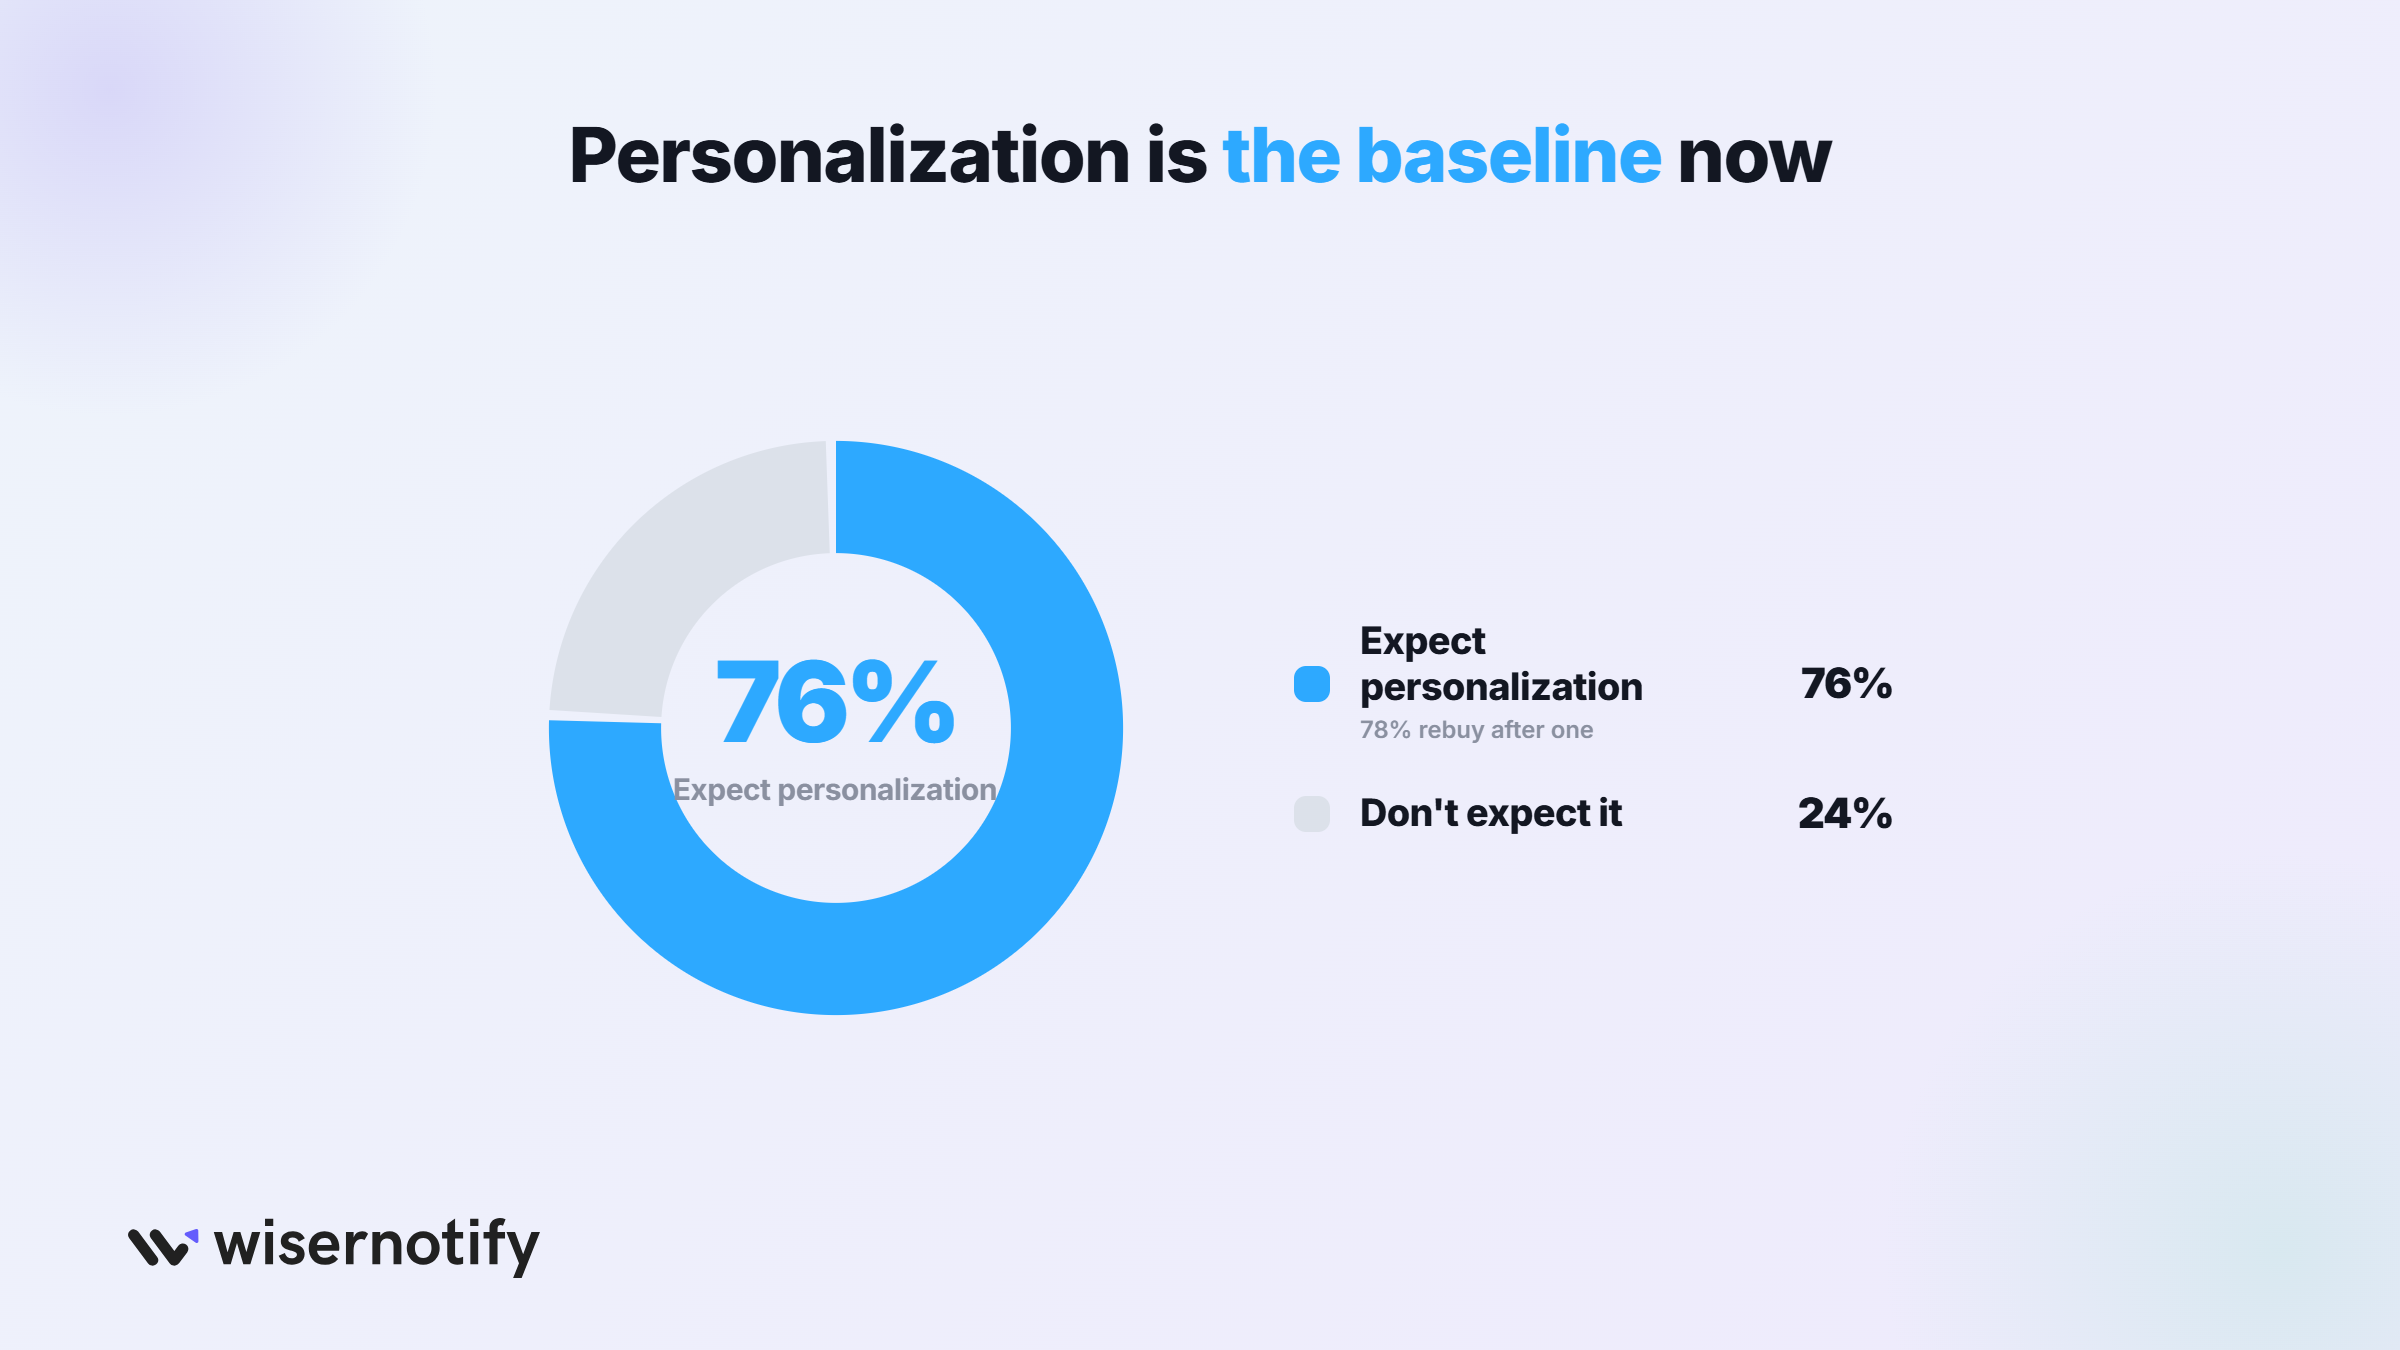
Personalization moved from a nice touch to the baseline expectation.
27. 76% of consumers expect personalized interactions from the brands they buy from.
28. 78% are more likely to buy again after a personalized experience.
29. 71% feel frustrated when their shopping experience is generic.
30. 44% of customers will switch to a brand that personalizes better.
31. 90% of customers are willing to share their data in exchange for a better, more relevant experience.
32. Brands that excel at personalization generate 40% more revenue from those efforts than average players.
33. 80% of consumers are more likely to purchase from brands that deliver personalized interactions.
Personalization is the cheapest experience upgrade available: the data already exists in your store. These ecommerce personalization statistics show exactly what it does to conversion.
Boost Conversion Instantly
Add Social Proof & Urgency to your website
AI and Customer Experience Statistics
AI went from experiment to infrastructure in two years, and it now shapes most service interactions.
34. Between 75% and 95% of all customer interactions in 2026 are expected to involve AI in some form.
35. Half of all service cases are expected to be resolved by AI by 2027, up from 30% in 2025.
36. Chat and messaging are now the dominant service channel at 45% of interactions, ahead of self-service at 32%, phone at 18%, and email at 5%.
37. The trust gap is real: only 41% of consumers believe AI or chatbots solve problems better than humans.
38. 76% of experience leaders say customer ratings improved with AI, by 31% on average.
39. Companies get the best results when AI handles routine questions and humans handle the exceptions, which is exactly the handoff most bots still fail.
40. Around a third of Gen Z (34%) and Millennials (35%) name 24/7 availability as a top requirement for great support, and AI is how brands afford it.
The AI lesson from the data: customers don’t hate bots, they hate dead ends. Speed wins when resolution follows, and losing a shopper to a dead end is expensive when you worked hard to attract customers to your product in the first place.
Customer Experience Market Statistics
The money flowing into experience tools tells you where businesses think growth lives.
41. The customer experience management market is worth between $16 billion and $26 billion in 2026, depending on how broadly it’s defined.
42. Forecasts see the market reaching about $48 billion by 2033, growing at 15.2% a year.
43. 80% of business leaders plan to increase their customer service budgets over the next year.
44. The gap between leaders and laggards is widening as AI-powered personalization compounds the advantage of brands already acting on customer data.
Omnichannel and Industry Statistics
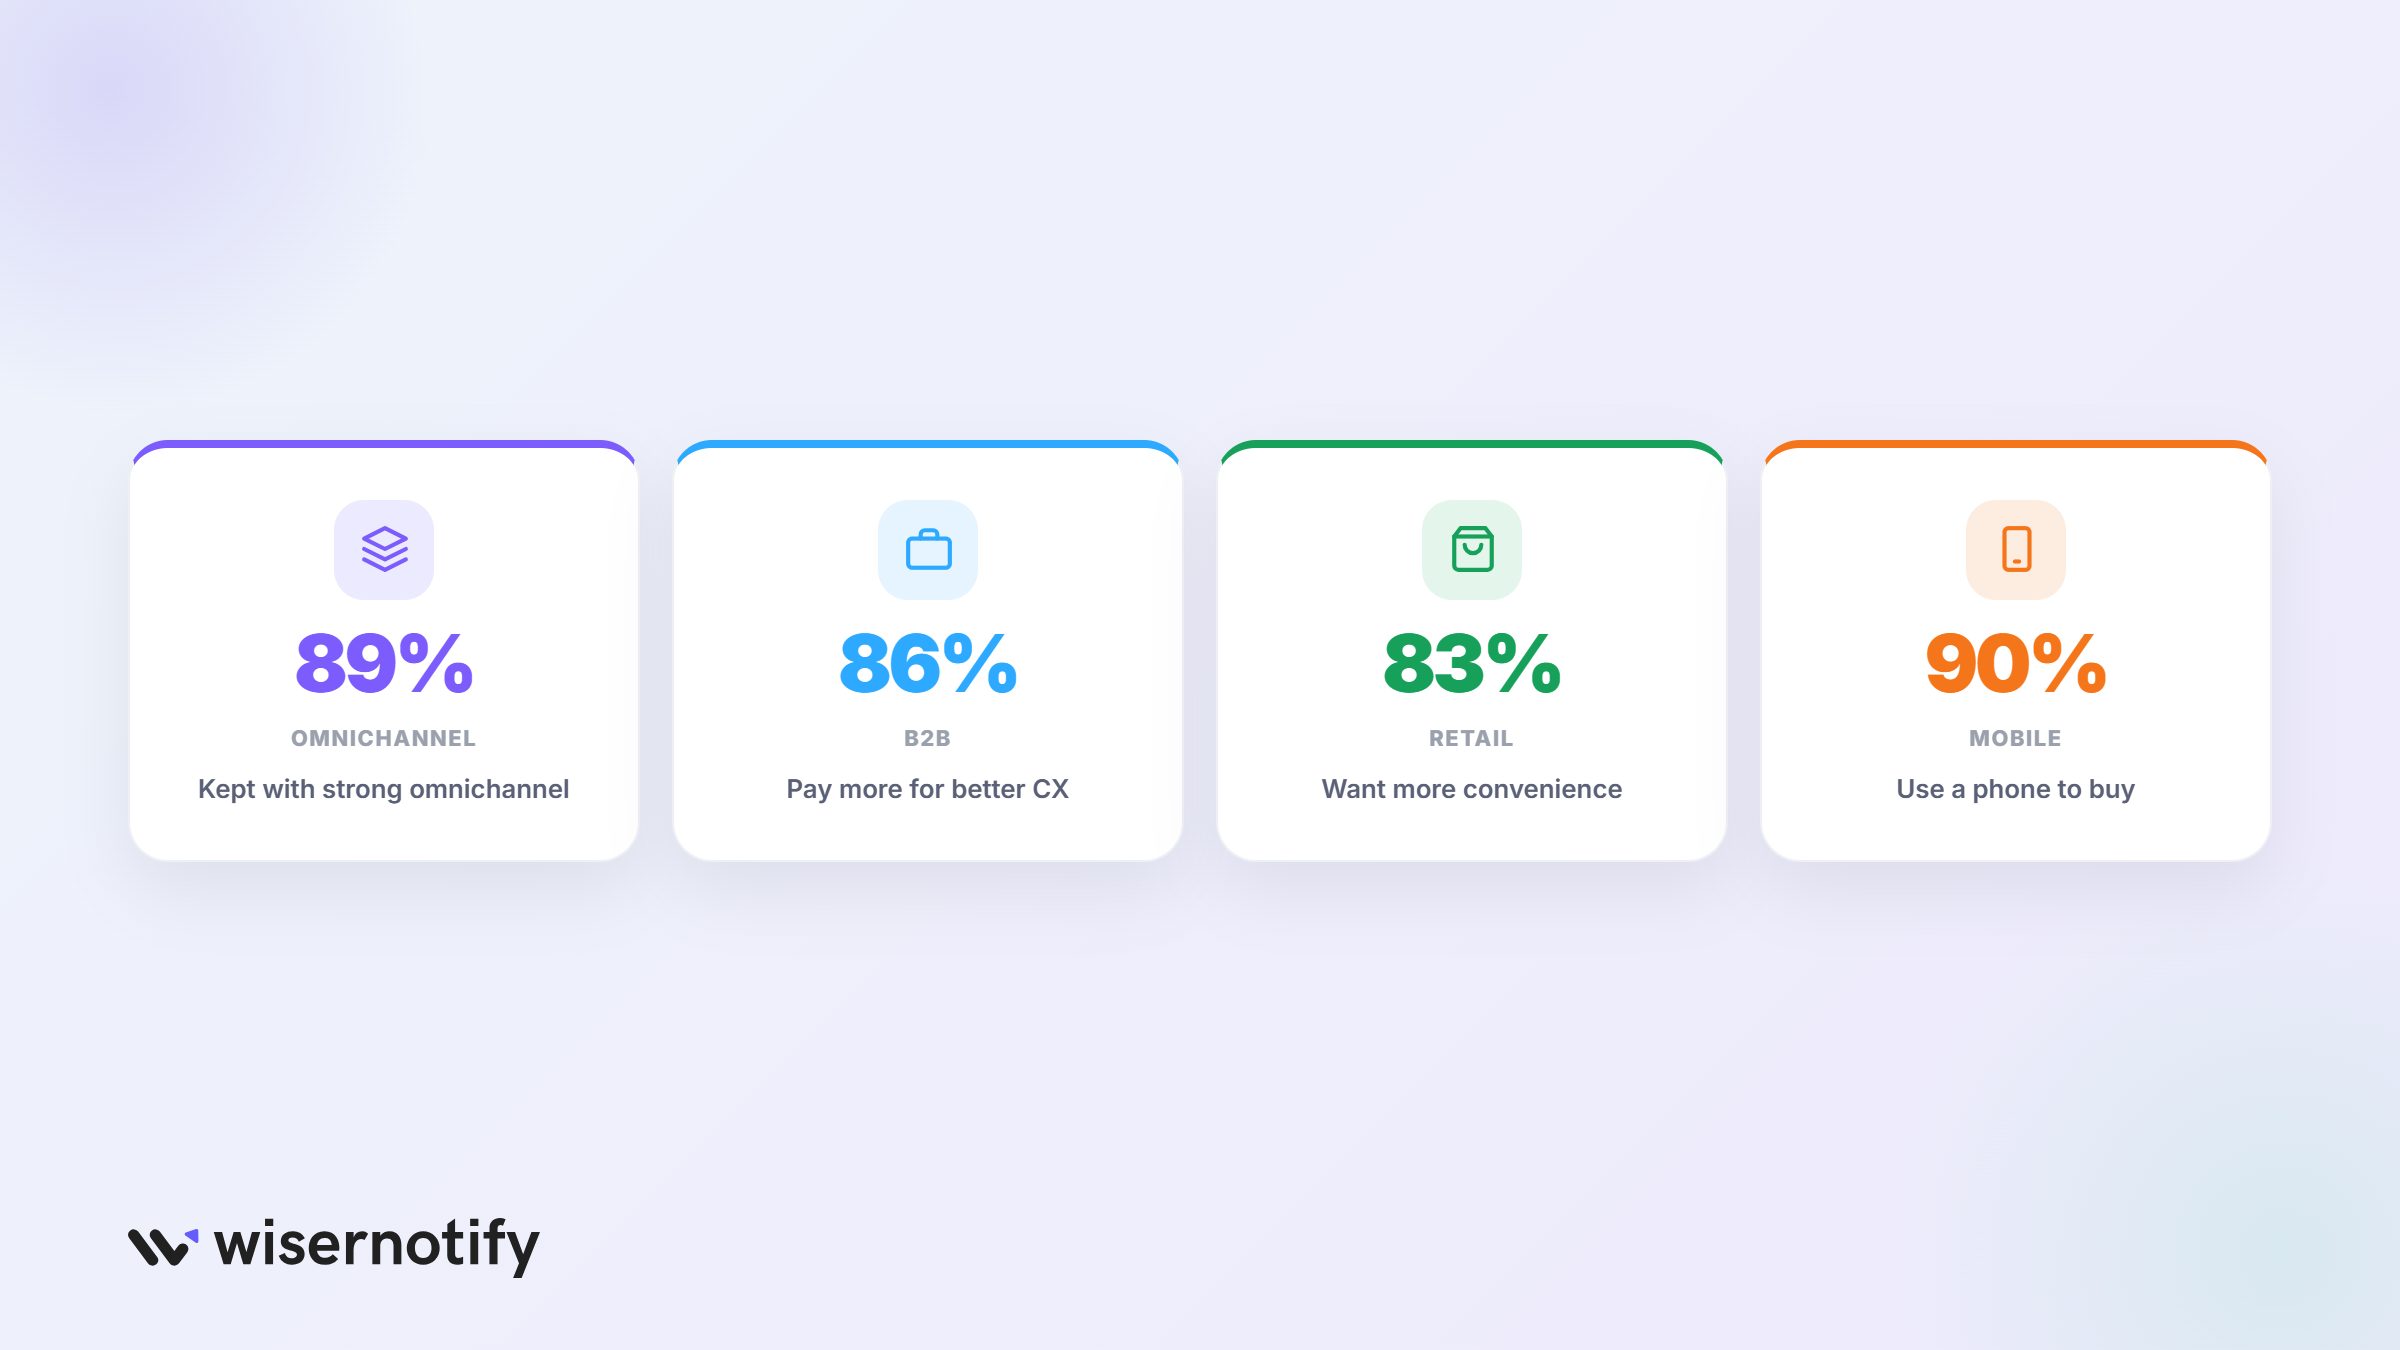
Experience expectations differ by channel and industry, but the pattern is consistent: consistency wins.
Omnichannel Experience
45. Companies with strong omnichannel strategies retain 89% of their customers, versus 33% for weak ones.
46. 73% of consumers use multiple channels during a single shopping journey.
47. 90% of customers expect consistent interactions across every channel and touchpoint.
Being everywhere matters less than being the same everywhere. These omnichannel statistics go deeper on the retention effect.
B2B Customer Experience
48. 86% of B2B buyers will pay more for a better experience, mirroring consumer behavior.
49. 59% of B2B buyers prefer to research without talking to a sales rep at all.
50. 77% of B2B buyers describe their latest purchase as very complex or difficult, which is the experience problem to solve.
B2C and Retail Experience
51. 83% of shoppers say convenience matters more now than it did five years ago.
52. 29% of consumers stopped buying from a retailer in the past year specifically because of poor experience, online or in person.
The retail store and the online store get judged as one brand. A smooth online shopping experience is now part of the product.
Mobile Experience
53. 57% of customers won’t recommend a business with a poorly designed mobile site.
54. 73% of mobile users have hit a site too slow to use, and most of them left instead of waiting.
55. About 90% of consumers use their smartphones somewhere in the purchase decision, so the mobile experience is the experience.
Boost Conversion Instantly
Add Social Proof & Urgency to your website
Wrap Up
The 2026 picture is unusual: customers care about experience more than ever, will pay more for it, and are getting less of it. Measured quality is at record lows while nearly every company claims to compete on it.
That gap is good news if you act on it. The winning moves in the data are simple: respond fast, personalize with the data you already have, let AI handle the routine and humans handle the exceptions, and stay consistent across every channel.
And close the loop with proof. Customers trust what other customers say more than what brands promise, so showing real reviews and real activity on your website turns good experiences into new sales.
Sources
Qualtrics XM Institute | PwC Future of CX | Zendesk CX Trends | Zoom CX Research | Grand View Research | McKinsey
Frequently Asked Questions
What is the future of customer service?
The future of customer service is AI-driven, with omnichannel support and predictive analytics. Personalisation can enhance customer interactions, and advanced self-service and mobile experiences improve efficiency and satisfaction.
How can data improve customer experience?
Data improves customer experience by providing personalized experiences, predicting customer needs, and providing insights for better service. It enhances decision-making and ensures consistency.
How to sell customer experience?
To sell customer experience, emphasise personalised interactions, consistent omnichannel support, and better service. These factors increase customer satisfaction, brand loyalty, and lifetime value.
Is customer experience of value?
Yes, customer experience is really valuable. It drives customer satisfaction, loyalty, and lifetime value, which impacts revenue growth. Businesses focusing on CX can reduce churn and focus on their overall performance.

Krunal Vaghasiya is a marketing tech expert who boosts e-commerce conversion rates with automated social proof and FOMO strategies. He loves to keep posting insightful posts on online marketing software, marketing automations, and improving conversion rates.




 Capterra