
40 Social Commerce Statistics & Trends (2026)
Social commerce is what happens when the scroll and the checkout merge. You see a product in a video, tap it, and buy it without ever leaving the app.
In 2026, that behavior stopped being a niche. US social commerce sales are crossing $100 billion for the first time this year, and TikTok Shop alone is projected to sell more online than Target or Costco.
I pulled the latest numbers from eMarketer, Statista, and current consumer surveys to show how big social commerce really is, which platforms actually convert, and where the money is moving next.

Boost Conversion Instantly
Add Social Proof & Urgency to your website
Key Social Commerce Statistics
Ten numbers that sum up social shopping in 2026. Figures are current as of July 2026, based on eMarketer forecasts, Statista market data, and 2026 consumer surveys.
| Metric | Latest Figure |
|---|---|
| US social commerce sales (2026) | $101 billion (+18%) |
| US social buyers | About 117 million |
| Share of US ecommerce | 8.9% (10%+ by 2027) |
| Share of global ecommerce | About 15% |
| China social commerce revenue | $366 billion |
| TikTok Shop US sales (2026 projection) | $23.4 billion |
| TikTok Shop conversion rate | 4.7% (highest of any platform) |
| Consumers using social for product discovery | 82% |
| Live shopping conversion rate | Up to 30% |
| Creator economy value (2026) | $20.6 billion (+16%) |
What Is Social Commerce?
Social commerce means selling products directly inside social media apps. Discovery, browsing, and checkout all happen in one place, without sending the shopper to a separate website.
That last part is what separates it from ordinary social media marketing. An ad that links to your store is marketing. A product tag that lets someone buy inside Instagram or TikTok is social commerce.
It works because it removes the moment where most sales die: the jump between seeing something and buying it.
Social Commerce Market Size Statistics
The market is growing far faster than ecommerce overall, though estimates of its exact size vary widely by definition.
Revenue Projections
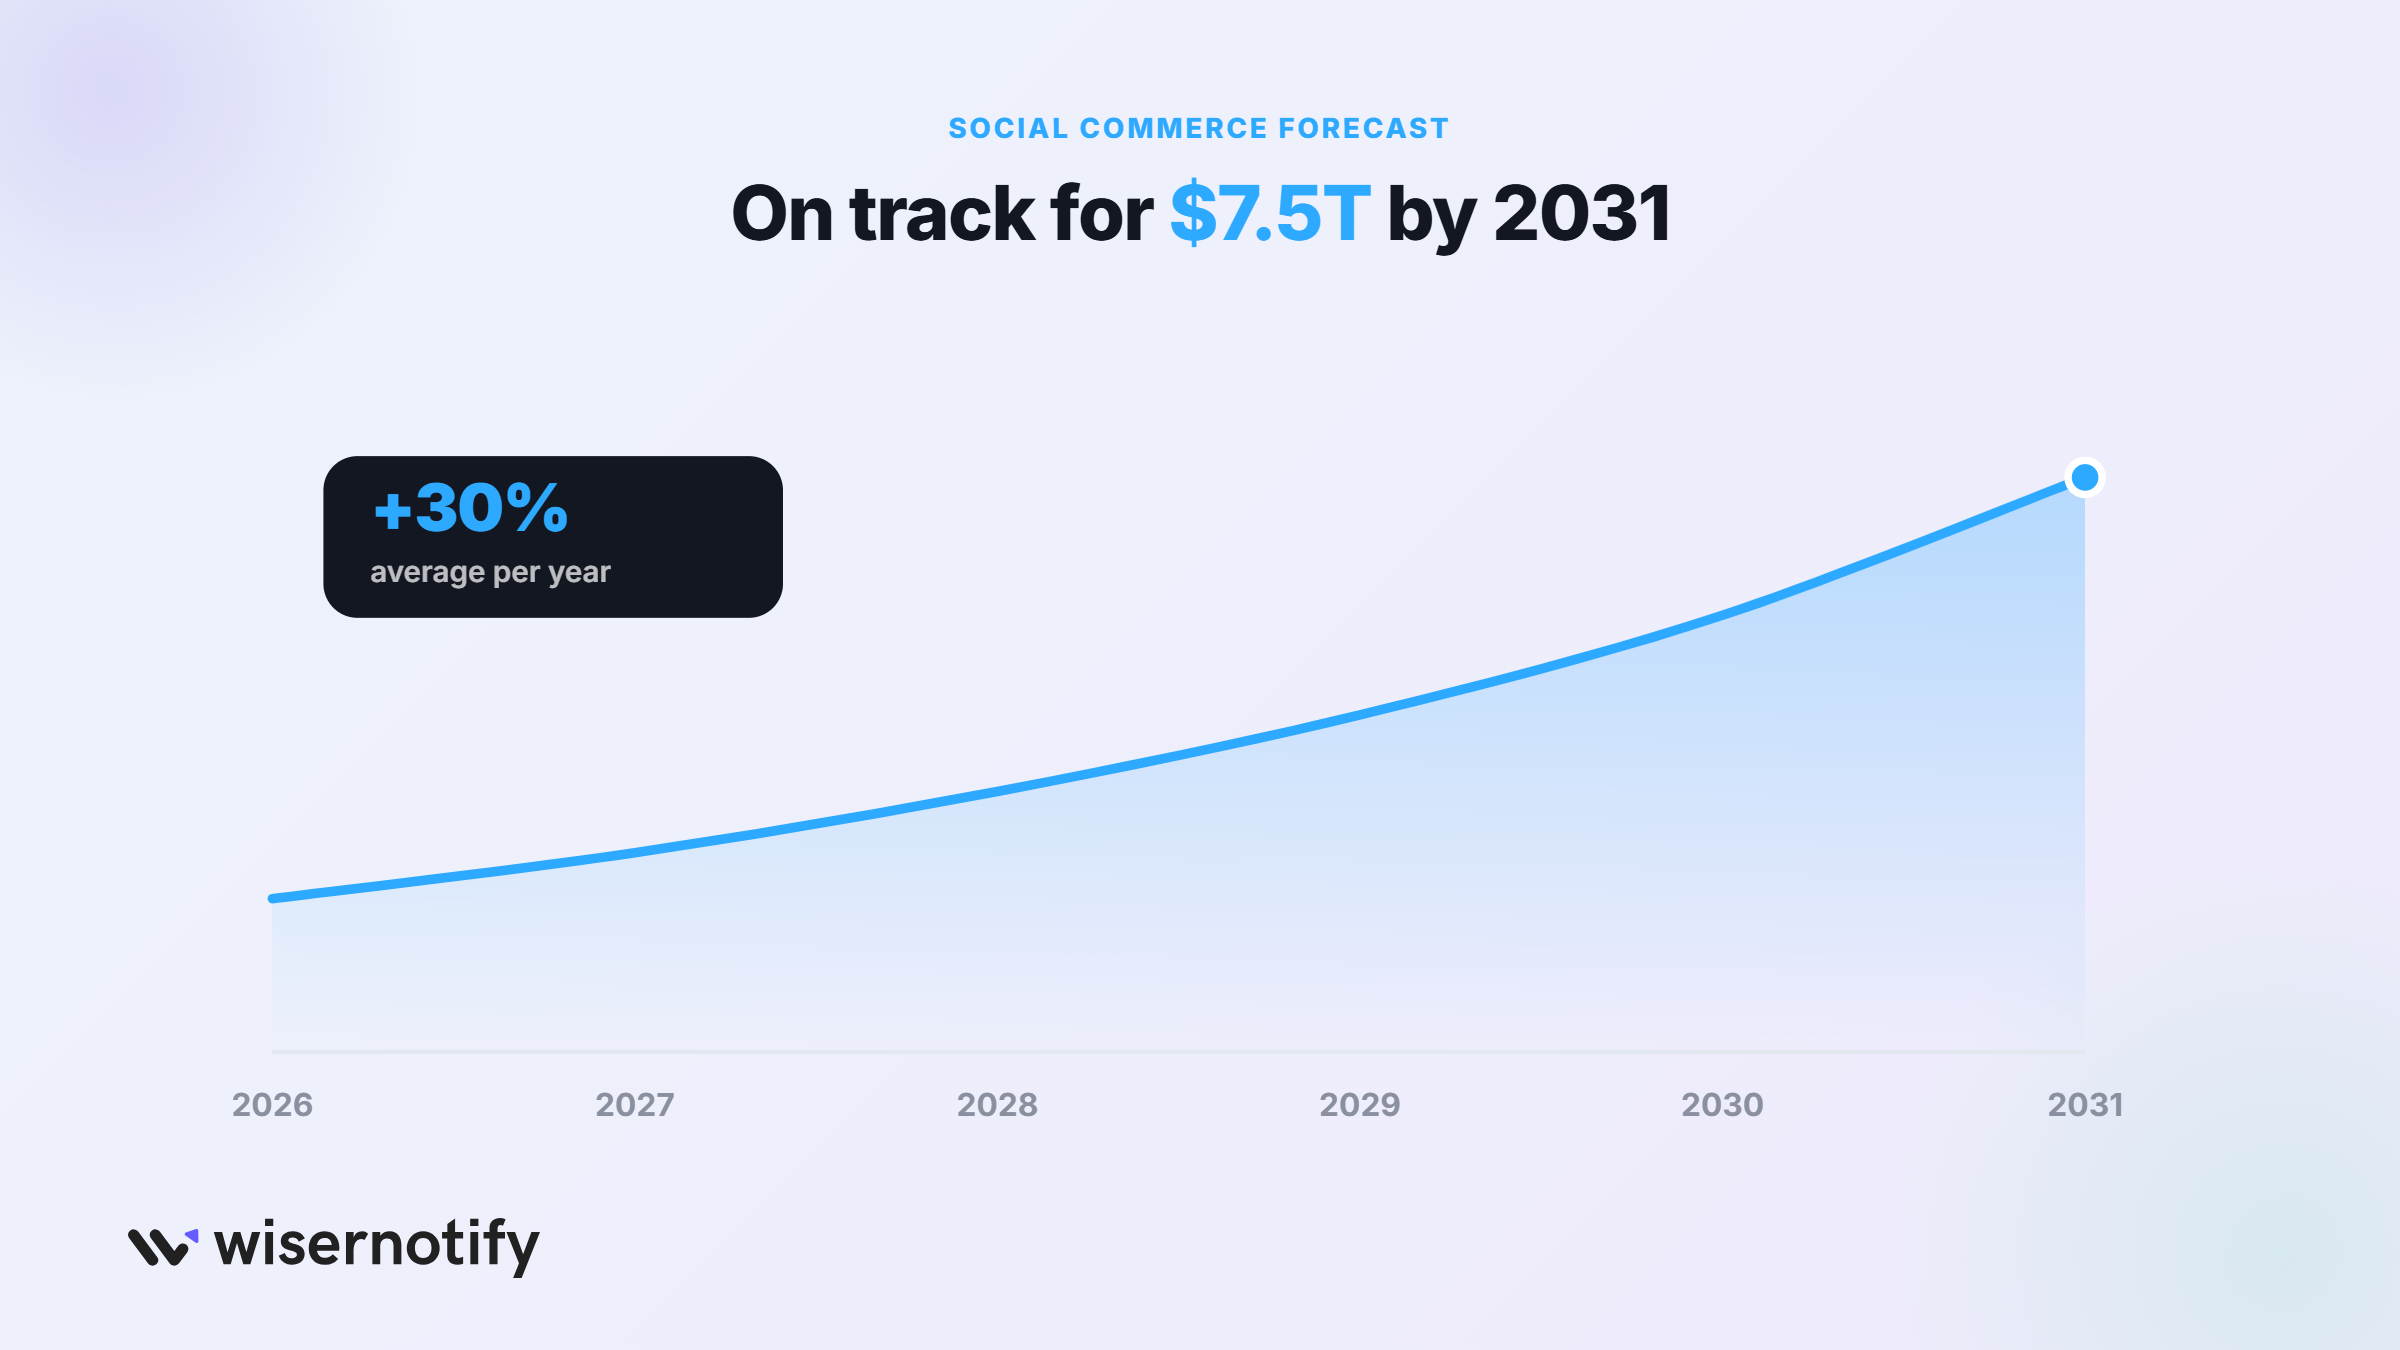
1. Global social commerce estimates for 2026 range from about $586 billion (Statista’s narrow definition) to over $2 trillion (broader industry counts), with mid-range forecasts near $1 trillion.
2. Whichever definition you use, the growth rate is the same story: 12% to 29% a year, at least twice as fast as ecommerce overall.
3. Broad-definition forecasts see the market reaching $7.5 trillion by 2031.
The spread in these numbers comes down to what gets counted: purchases completed inside apps only, or every sale a social platform influenced.
Regional Growth
4. China remains the giant, generating an estimated $366 billion in social commerce revenue in 2026.
5. Social commerce now makes up about 15% of all ecommerce worldwide, up from 10% in 2021.
6. The United States is the fastest growing major market, with 15% to 20% annual growth forecast through 2028.
How Many People Buy on Social Media
7. 82% of consumers use social media to discover and research products before buying.
8. 67% of US consumers now buy something through social media at least once a month.
9. About 27% of social media users say finding products to buy is a reason they open the apps at all.
US Social Commerce Buyers
10. US social commerce sales will pass $100 billion for the first time in 2026, reaching $101 billion, up 18% in one year.
11. About 117 million Americans, roughly one in three, will buy through social media in 2026.
12. Social commerce now accounts for 8.9% of all US ecommerce sales, and crosses 10% by 2027.
13. The average US social buyer will spend about $1,220 a year by 2027, up from under $1,000 today.
Age Demographics
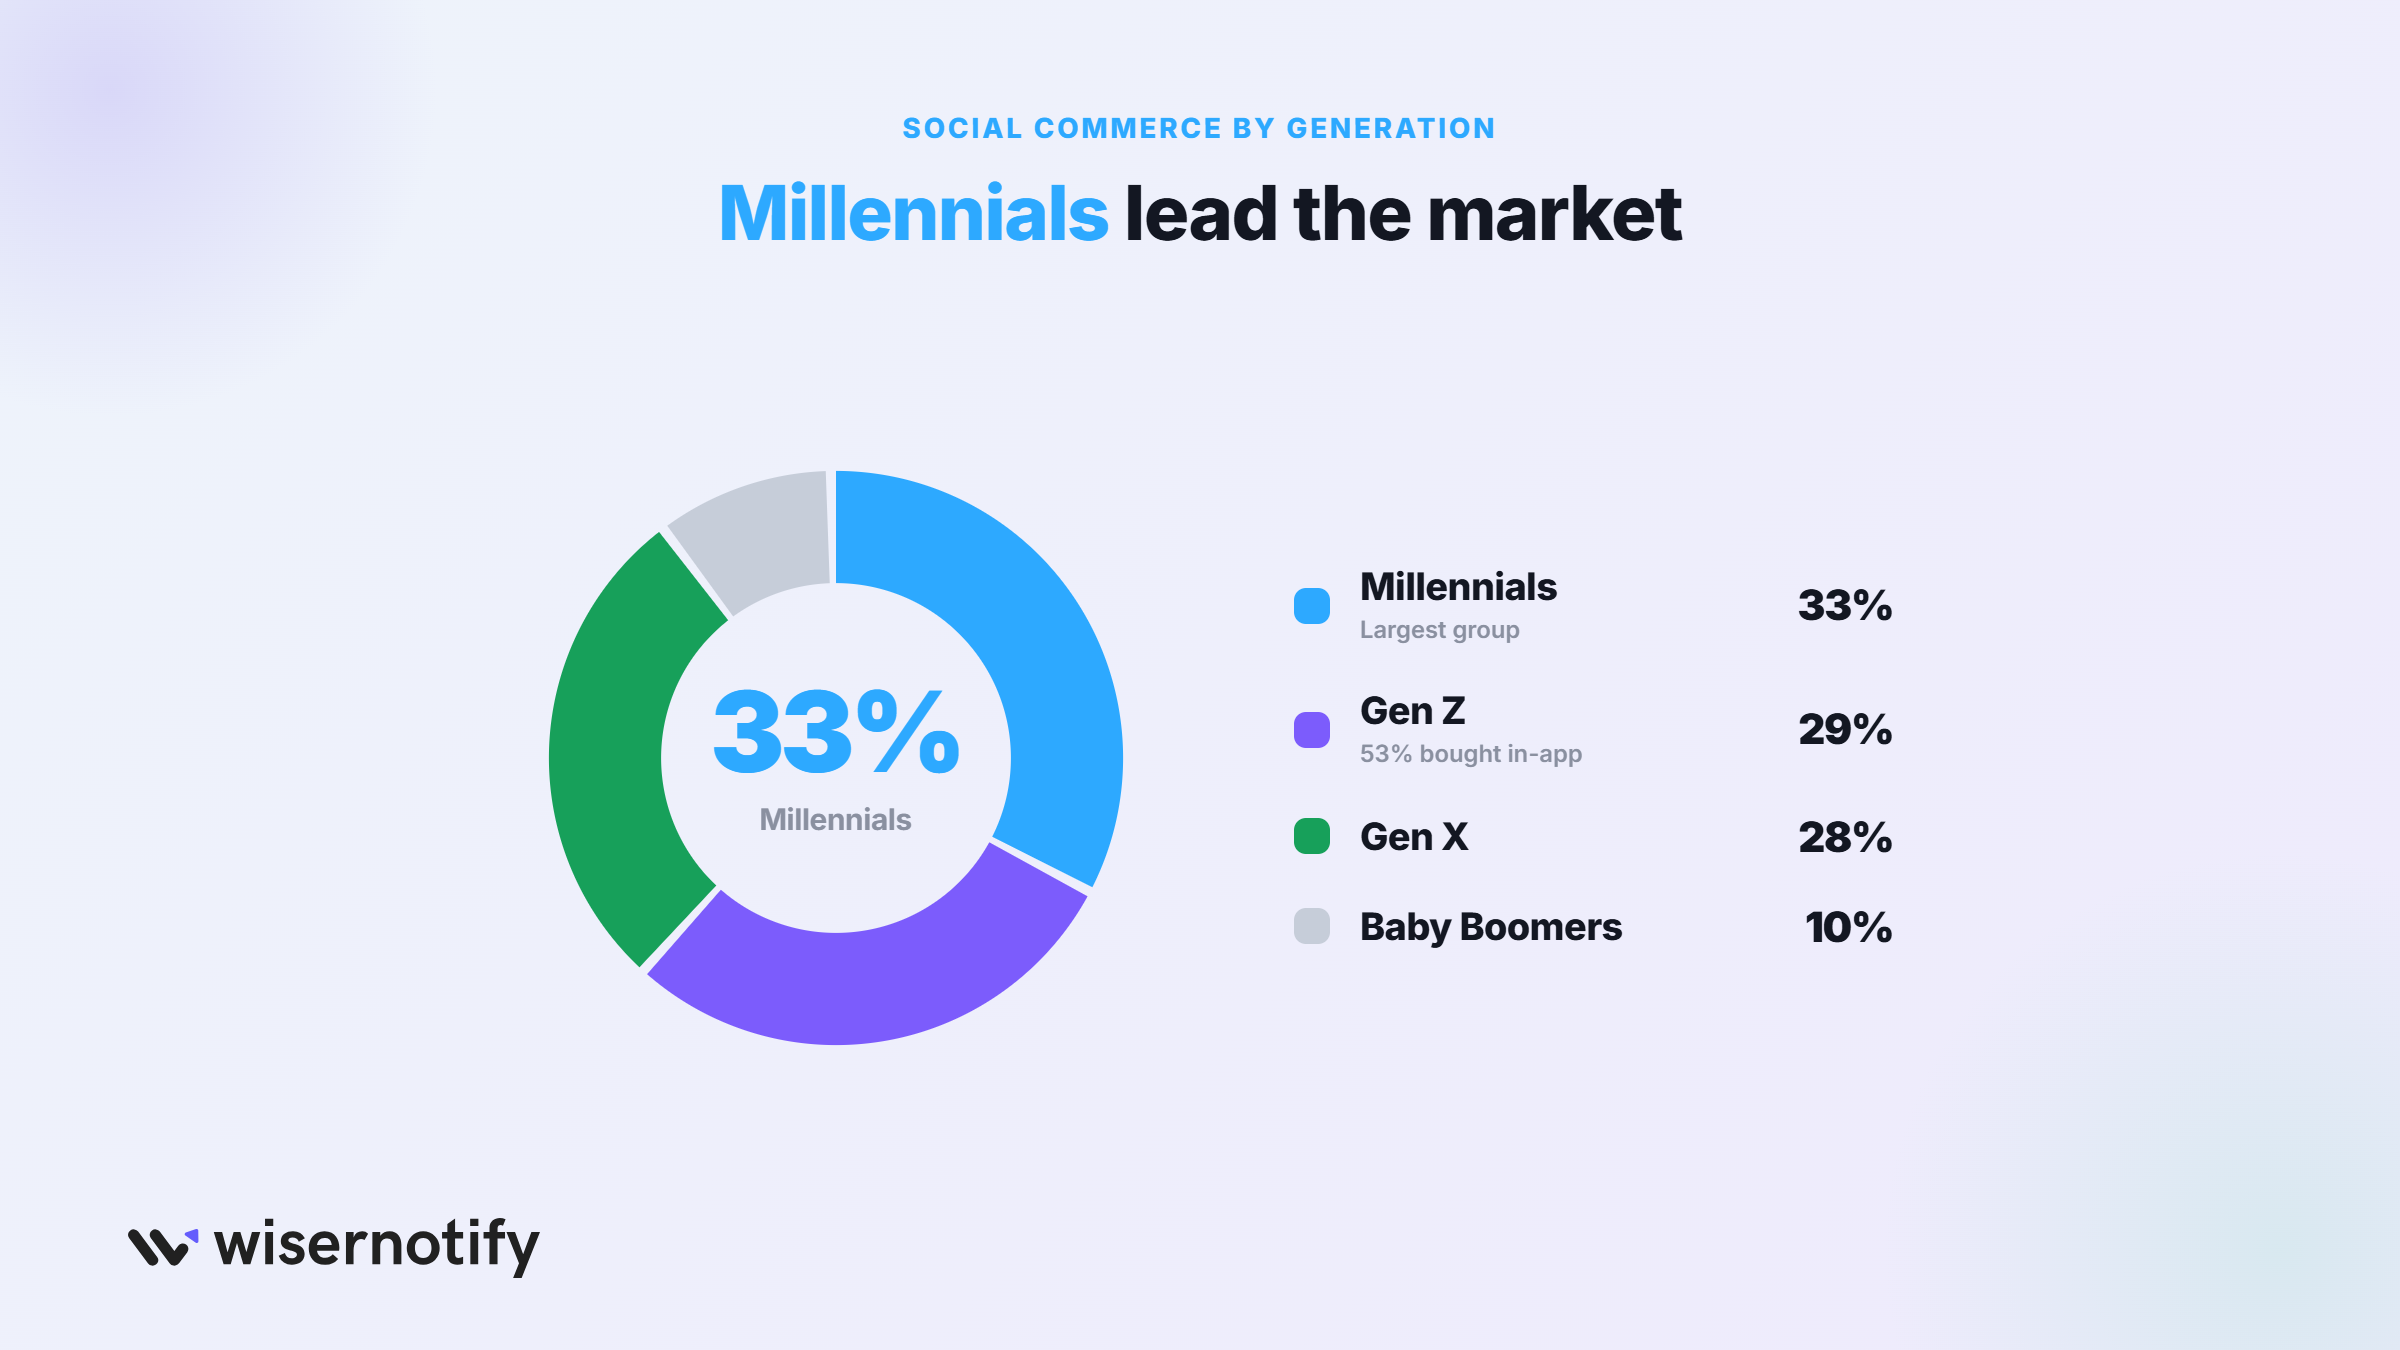
14. Millennials are the largest social shopping group, with Gen Z close behind at 29% of the market and Gen X at 28%.
15. 53% of Gen Z consumers have completed a purchase directly inside a social app.
16. Baby Boomers hold just 10% of the social commerce market, the clearest generational gap in ecommerce.
If your customers are under 45, social commerce is not an experiment anymore. It’s where a third of their shopping discovery happens.
These online shopping statistics show the same generational split across all of ecommerce.
Boost Conversion Instantly
Add Social Proof & Urgency to your website
Social Commerce Platform Statistics
The platform war has a clear new leader on conversion, even while Facebook keeps the biggest audience.
17. Facebook is still the most used social commerce platform overall, and the clear favorite among shoppers over 35.
18. Digital shoppers are 77% more likely to buy on Facebook than on any other social platform.
19. 52% of Millennials name Facebook as their preferred platform for product research.
20. Over 70% of Instagram’s active users browse or shop products on the platform.
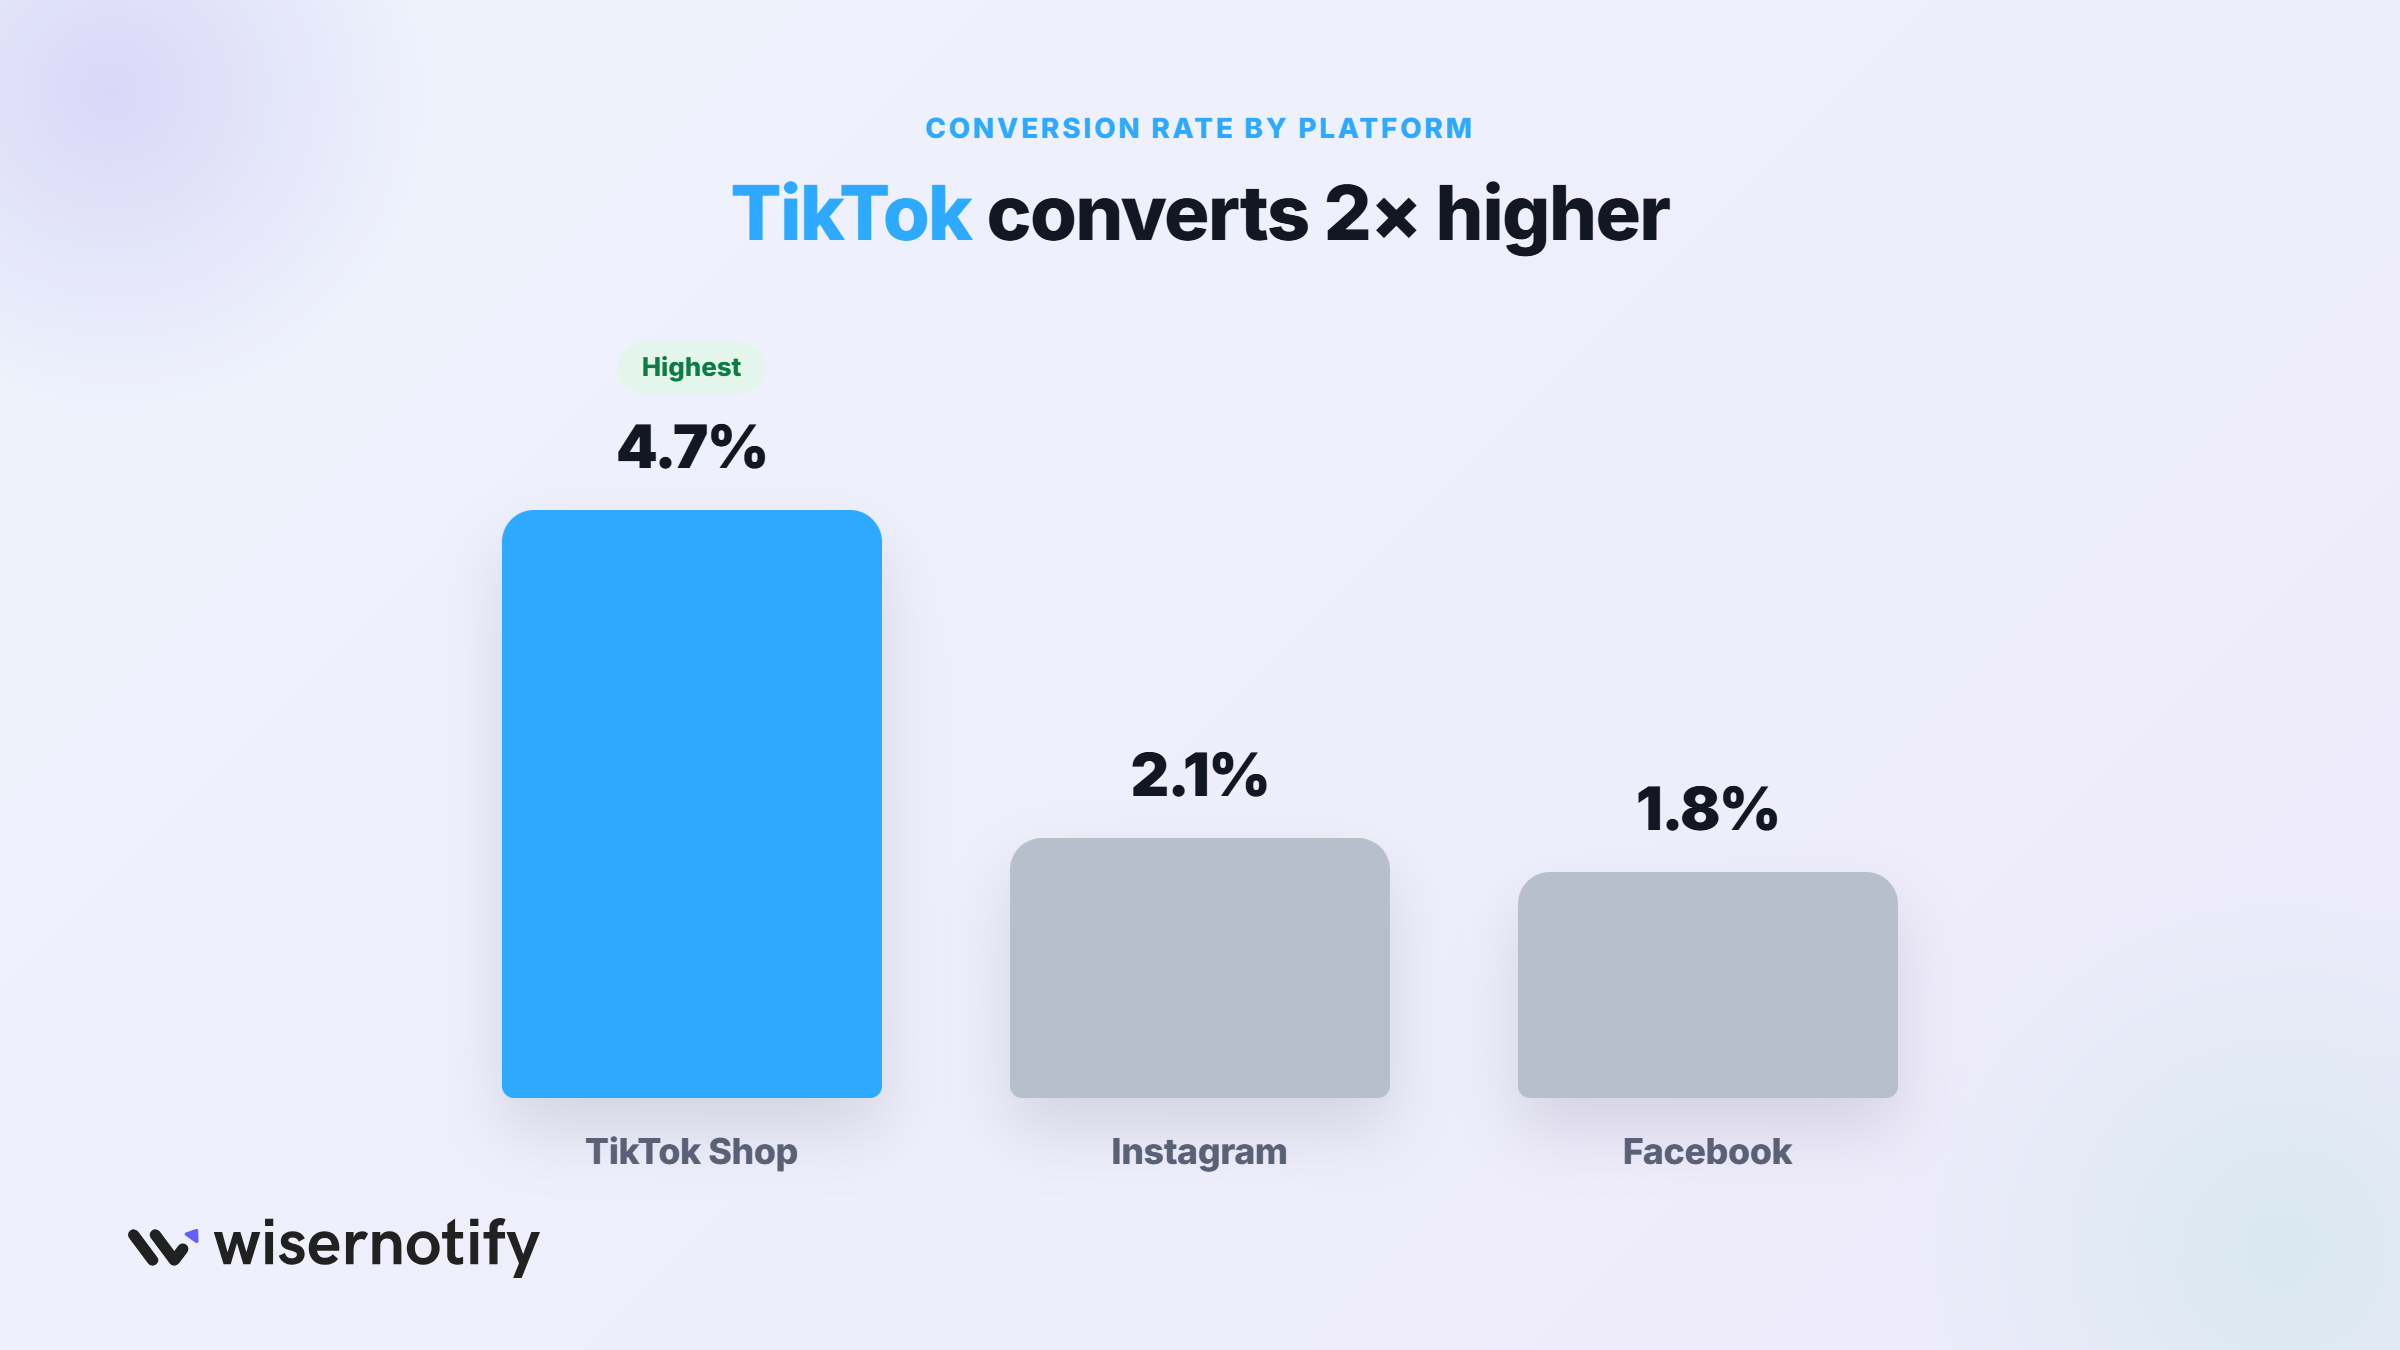
21. Instagram Shopping converts at about 2.1%, ahead of Facebook Shops at 1.8%.
TikTok
22. TikTok Shop is projected to hit $23.4 billion in US ecommerce sales in 2026, more than Target or Costco sell online.
23. TikTok Shop captured 18.2% of all US social commerce in 2025, just three years after launching.
24. Its 4.7% conversion rate is the highest of any social platform, more than double Instagram’s.
25. 55% of Gen Z prefer TikTok over search engines for researching products.
YouTube and Other Platforms
26. YouTube is the top product discovery channel for 70% of Gen Z shoppers.
27. Cards remain the preferred way to pay for social purchases, chosen by 62% of consumers.
The platform lesson is simple: Facebook has the buyers, TikTok has the buying behavior.
Picking where to sell starts with where your audience already shops, and this guide to the best social commerce platforms breaks that down.
Boost Conversion Instantly
Add Social Proof & Urgency to your website
What Makes Social Shoppers Buy
Social commerce runs on trust signals: reviews, creators, and other people’s purchases visible in the feed.
28. 58% of adults say they have bought a product because a creator or influencer endorsed it.
29. Here’s the paradox: 26% of consumers say they don’t trust influencer marketing, over twice the share who distrust regular ads, yet they keep buying through it because discovery happens there first.
30. The creator economy behind those endorsements reached $20.6 billion in 2026, growing 16% in a year.
31. 72% of internet users research brands on social media before making a purchase decision.
Buyers rarely trust a brand’s own posts as much as they trust other buyers. That’s why user generated content and a clear call to action outperform polished brand creative inside social feeds.
Social Commerce Trends

Three formats are pulling ahead of everything else: live shopping, AR try-on, and short-form video.
Live Stream Shopping
32. Live shopping streams convert at up to 30%, compared with 2% to 3% for standard ecommerce pages.
33. China built its $366 billion social commerce market largely on live commerce, and Western platforms are copying the playbook.
Urgency is the engine here: limited drops, live discounts, and viewers seeing others buy in real time.
Augmented Reality Try-On
AR try-on lets shoppers preview glasses, makeup, or furniture through their camera before buying.
Platforms keep investing in it for one reason: it attacks the biggest weakness of social buying, which is not being able to touch the product. Fewer surprises means fewer returns.
Short-Form Video and AI
34. Short-form video is the dominant discovery format, which is why TikTok converts at double the rate of feed-based platforms.
35. AI-powered product recommendations and in-app payments are the two forces analysts credit for social commerce growing twice as fast as ecommerce overall.
Video sells because it shows the product in use, in a real person’s hands. These video marketing statistics show how far that effect reaches beyond social commerce.
Boost Conversion Instantly
Add Social Proof & Urgency to your website
Where Social Commerce Is Heading
Every forecast points the same direction: social platforms take a bigger slice of retail every year.
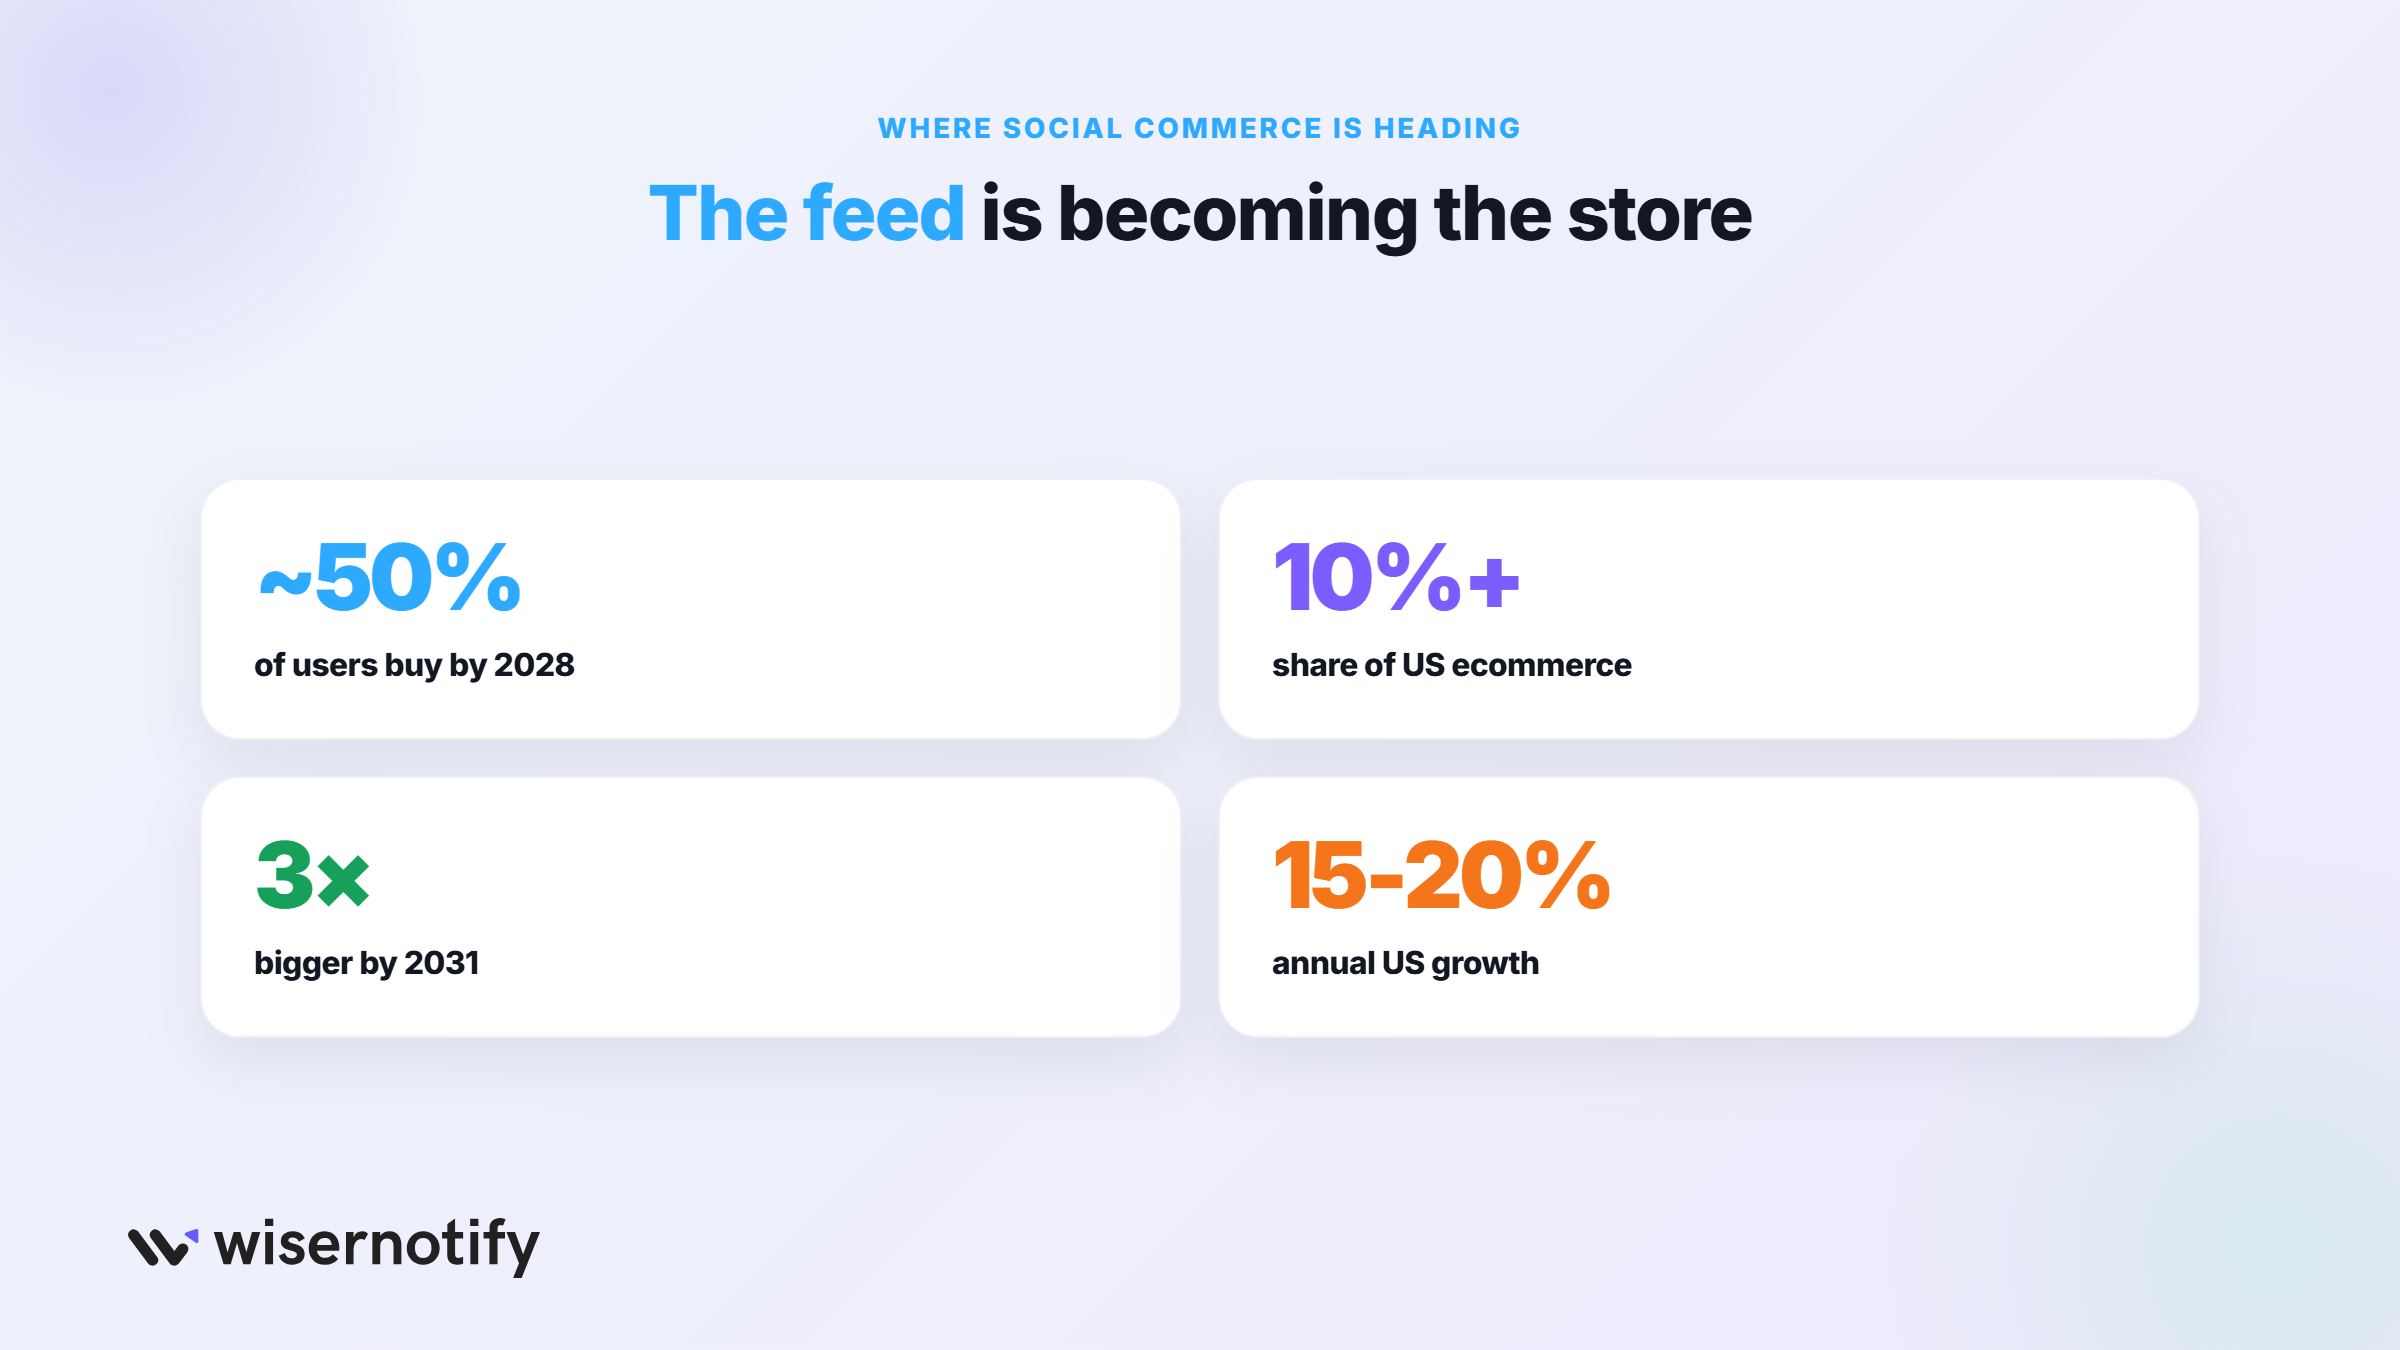
36. US social commerce is forecast to keep growing 15% to 20% a year through 2028.
37. By 2028, nearly half of all US social media users will be social commerce buyers.
38. Social commerce’s share of US ecommerce climbs past 10% in 2027, from 8.9% today.
39. Broad global forecasts project the market more than tripling between 2026 and 2031.
40. Facebook and TikTok Shop rank as the two most used social buying destinations worldwide in 2026 surveys, and both keep adding checkout features.
The takeaway for sellers: the feed is becoming the store. Brands that treat social selling as a side channel are competing against brands that treat it as the main one.
These social selling statistics and product recommendation strategies cover how to act on it.
Boost Conversion Instantly
Add Social Proof & Urgency to your website
Wrap Up
Social commerce crossed the line from trend to infrastructure. When US sales pass $100 billion and one platform outsells Target online, the question stops being whether to sell on social and becomes how well you do it.
The data points to a simple playbook: be where your buyers already scroll, use creators and real customer content instead of polished ads, and make checkout happen inside the app.
And remember what actually converts on social: proof that other people are buying. Reviews, purchase activity, and live social proof close the trust gap that keeps scrollers from becoming customers.
Sources
Capital One Shopping Research | SellersCommerce | Statista | SQ Magazine (eMarketer data) | Hostinger Consumer Survey
Frequently Asked Questions
How big is social commerce in 2026?
Estimates range from about $600 billion to $2 trillion globally, and US sales alone pass $100 billion this year.
What share of ecommerce is social commerce?
About 15% worldwide and about 9% in the US.
Which platform converts best?
TikTok Shop, at about 4.7%, more than double Facebook or Instagram.
Who buys through social media?
About 117 million Americans. Millennials and Gen Z lead the way.
What is the fastest growing social commerce trend?
Live shopping, which can convert at up to 30%.

Krunal Vaghasiya is a marketing tech expert who boosts e-commerce conversion rates with automated social proof and FOMO strategies. He loves to keep posting insightful posts on online marketing software, marketing automations, and improving conversion rates.




 Capterra