
35 Social Selling Statistics for 2026 (SSI Score Guide)
Most social selling advice stops at “post more, engage more.” It rarely explains the actual scoring system behind it, or why some reps quietly outsell everyone else without trying any harder.
The difference usually comes down to a habit most reps have never heard of, LinkedIn’s own Social Selling Index. It rewards consistency over cleverness, and most teams have never been shown how it works.
This page walks through what the score measures, what wins on LinkedIn specifically, and how social selling looks across different parts of the world.

Boost Conversion Instantly
Add Social Proof & Urgency to your website
Key Social Selling Statistics
| Metric | Latest Figure |
|---|---|
| More opportunities generated by reps with a high SSI score | 45% more |
| High-SSI reps more likely to hit quota | 51% more likely |
| Sales professionals who use social selling tools | 71% |
| Social sellers who outperform reps who don’t | 78% |
| Sales executives who never had formal social selling training | 93% |
| Global social media users worldwide | 5.79 billion |
| B2B social media leads that come from LinkedIn | 80% |
| Global social commerce market size, 2026 | $2.6 trillion |
| Close rate for inbound authority-based leads vs cold outbound | 14.6% vs 1.7% |
| B2B marketing conducted on LinkedIn specifically | 86% |
How Does LinkedIn’s SSI Score Work?
The Social Selling Index is a free, daily-updated LinkedIn metric that most sales teams have heard of but few understand or track.
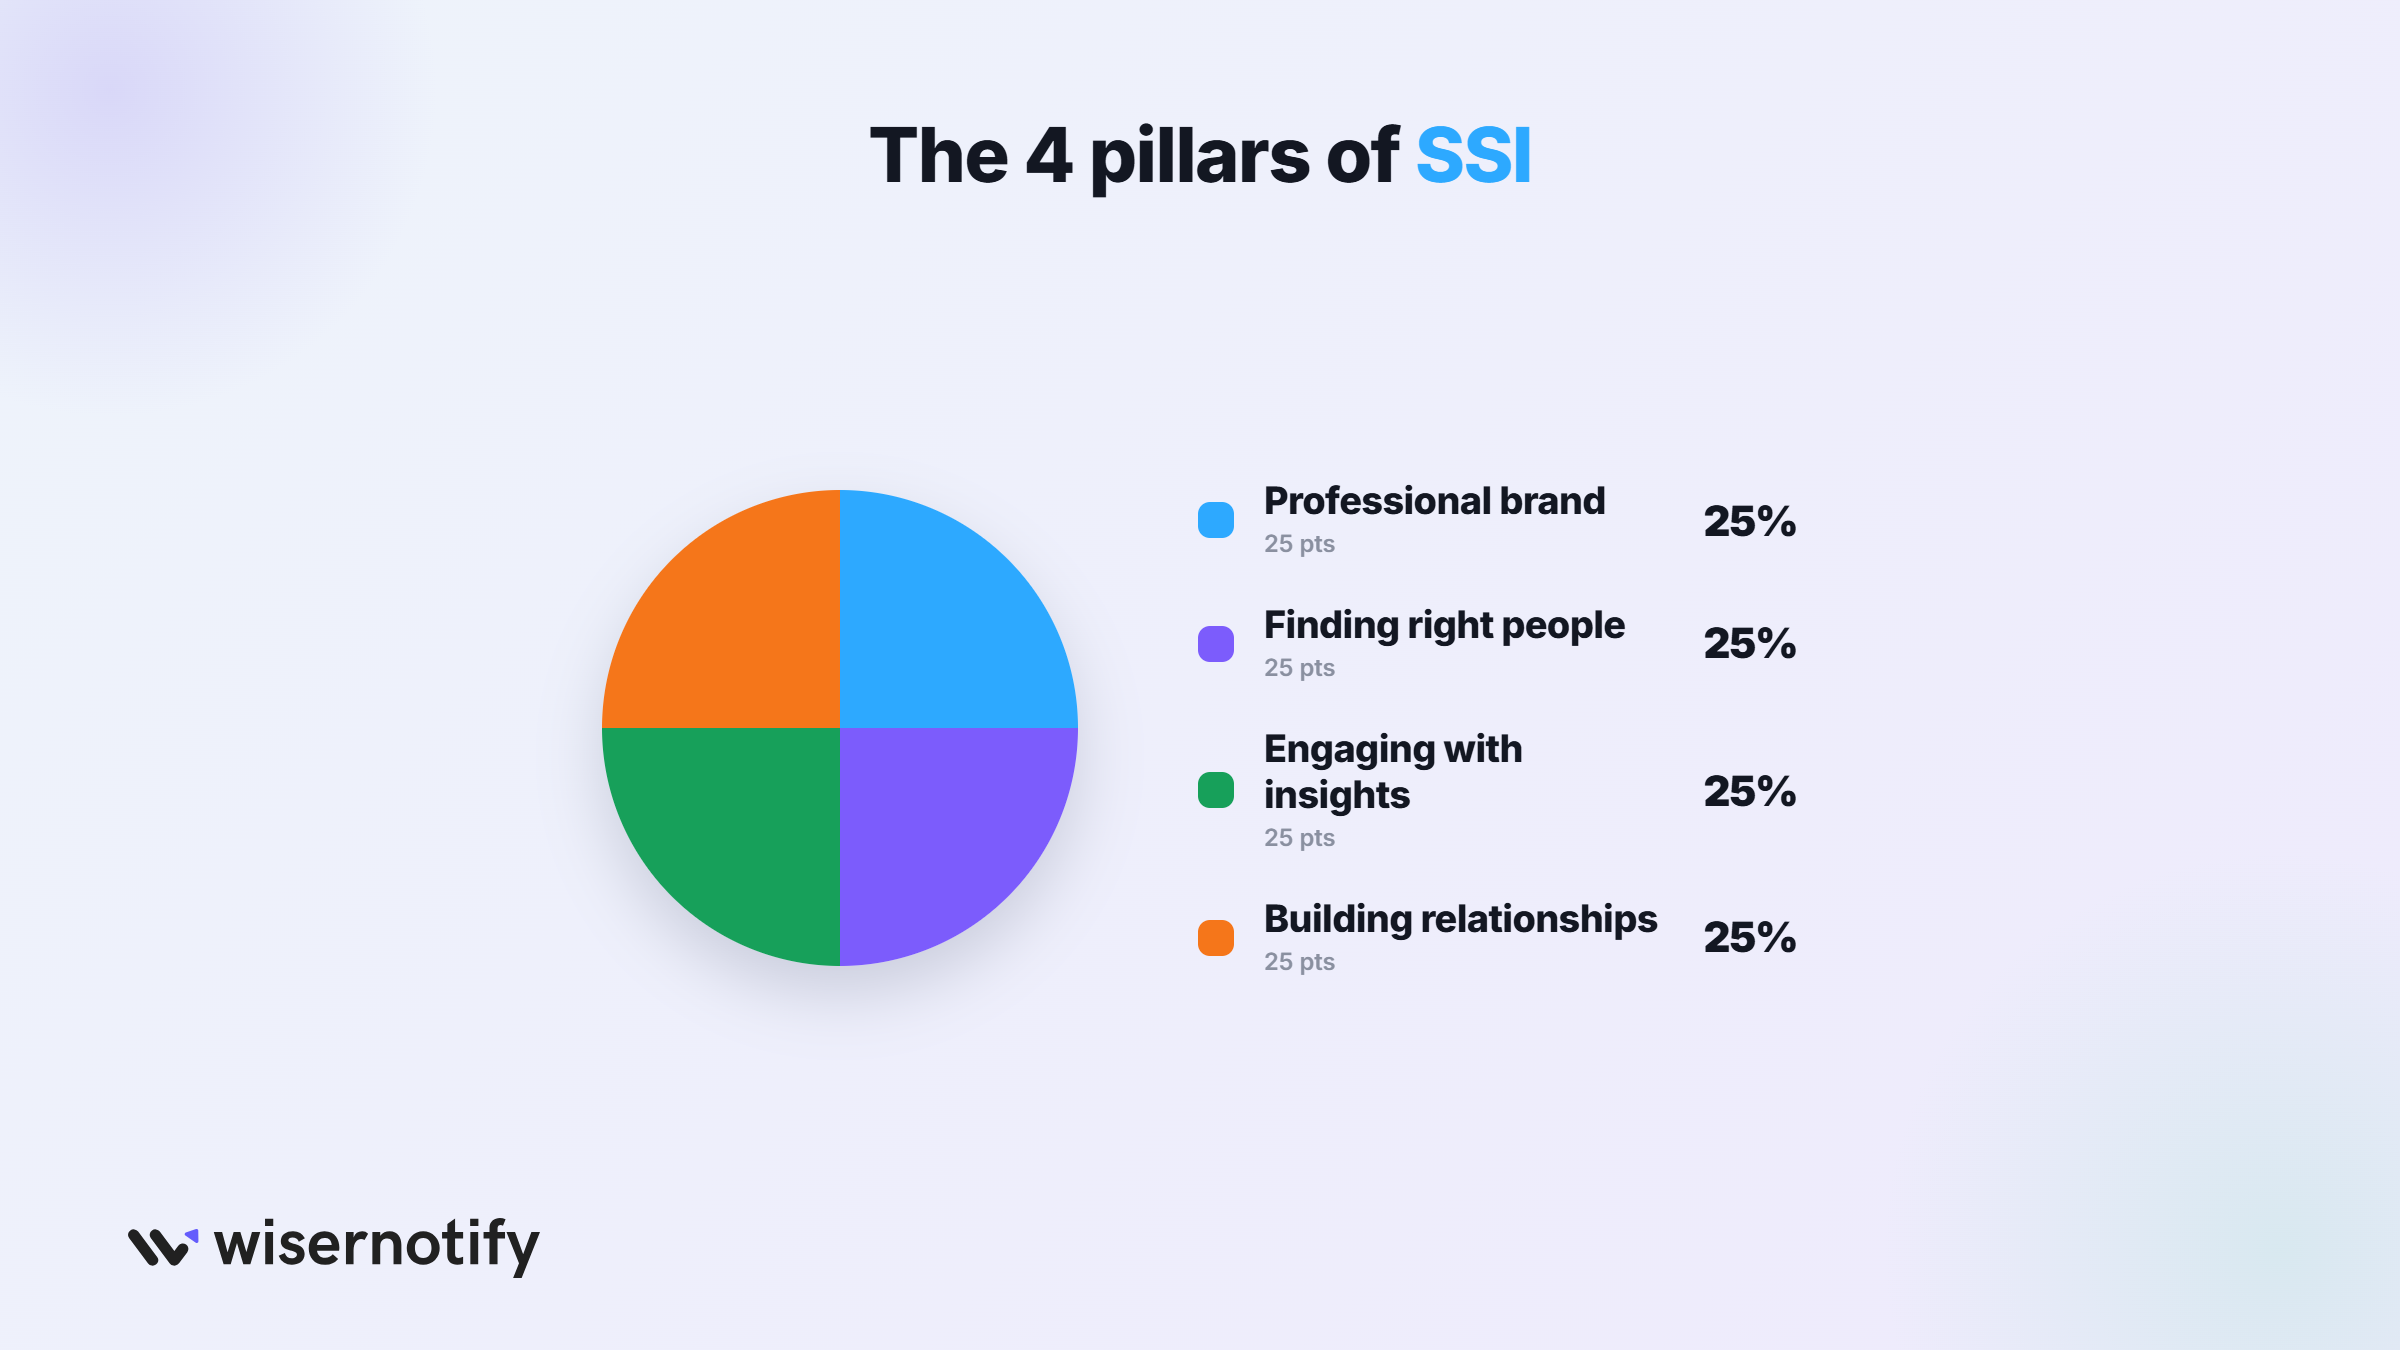
1. The SSI score runs from 0 to 100 and is built from 4 pillars, each worth up to 25 points: professional brand, finding the right people, engaging with insights, and building relationships.
2. The average SSI score across all industries falls between 26 and 50.
3. An SSI score above 75 places a professional in the top 1% of their industry.
4. Reps with a high SSI score generate 45% more sales opportunities than reps with a low score.
5. Teams with a high average SSI show sales cycles that run about 18% shorter.
6. SSI does not require a paid Sales Navigator subscription. Every LinkedIn member can check their score for free.
The SSI score rewards consistent behavior more than clever tactics. Reps who show up daily with genuine engagement outscore reps who only log in occasionally to post.
Boost Conversion Instantly
Add Social Proof & Urgency to your website
What Does Social Selling Adoption Look Like in 2026?
Adoption has shifted from early-adopter territory to a baseline expectation for most B2B sales teams.
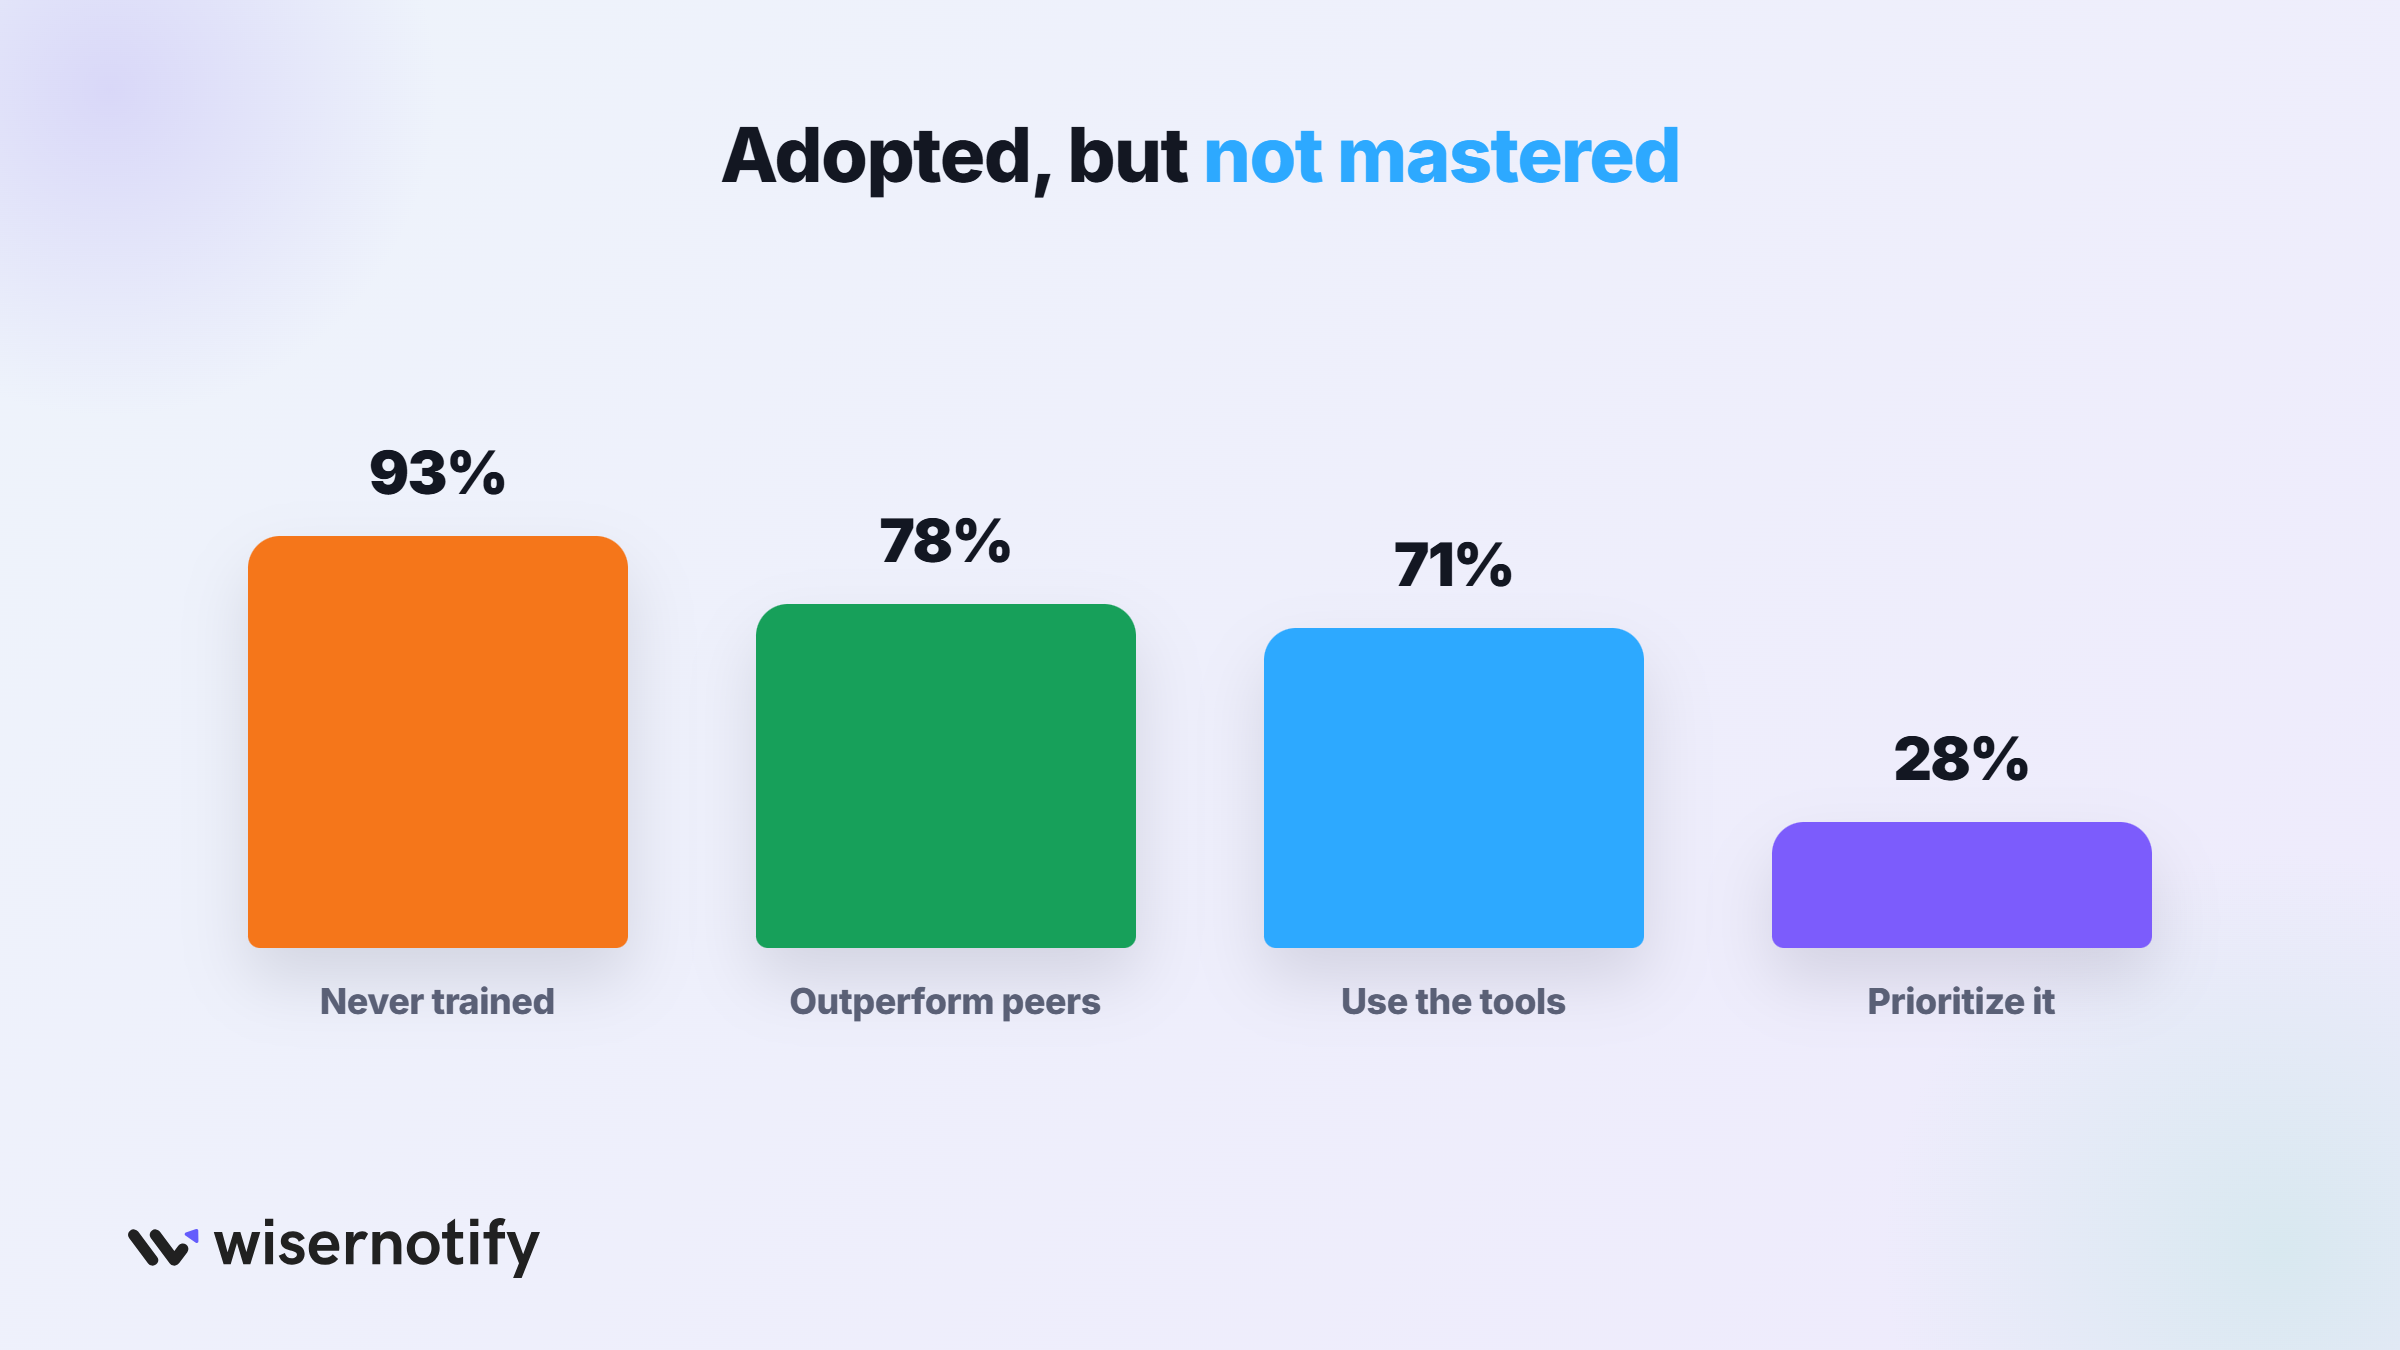
7. 71% of sales professionals now use social selling tools like Sales Navigator, up from far lower adoption just a few years ago.
8. Among millennial sales reps specifically, 78% use social selling tools and 63% say it drives real results for their business.
9. 78% of social sellers outperform peers who do not use social media as part of their sales process.
10. 93% of sales executives report they have never received formal training on social selling, despite widespread adoption of the tools.
11. 28% of companies surveyed say they are actively prioritizing social selling as a strategic sales channel.
That training gap is the single biggest opportunity on this page, the same execution gap covered in our lead generation statistics.
How Does Inbound Social Selling Compare to Cold Outreach?
The gap between warm, opt-in engagement and cold prospecting has widened significantly.
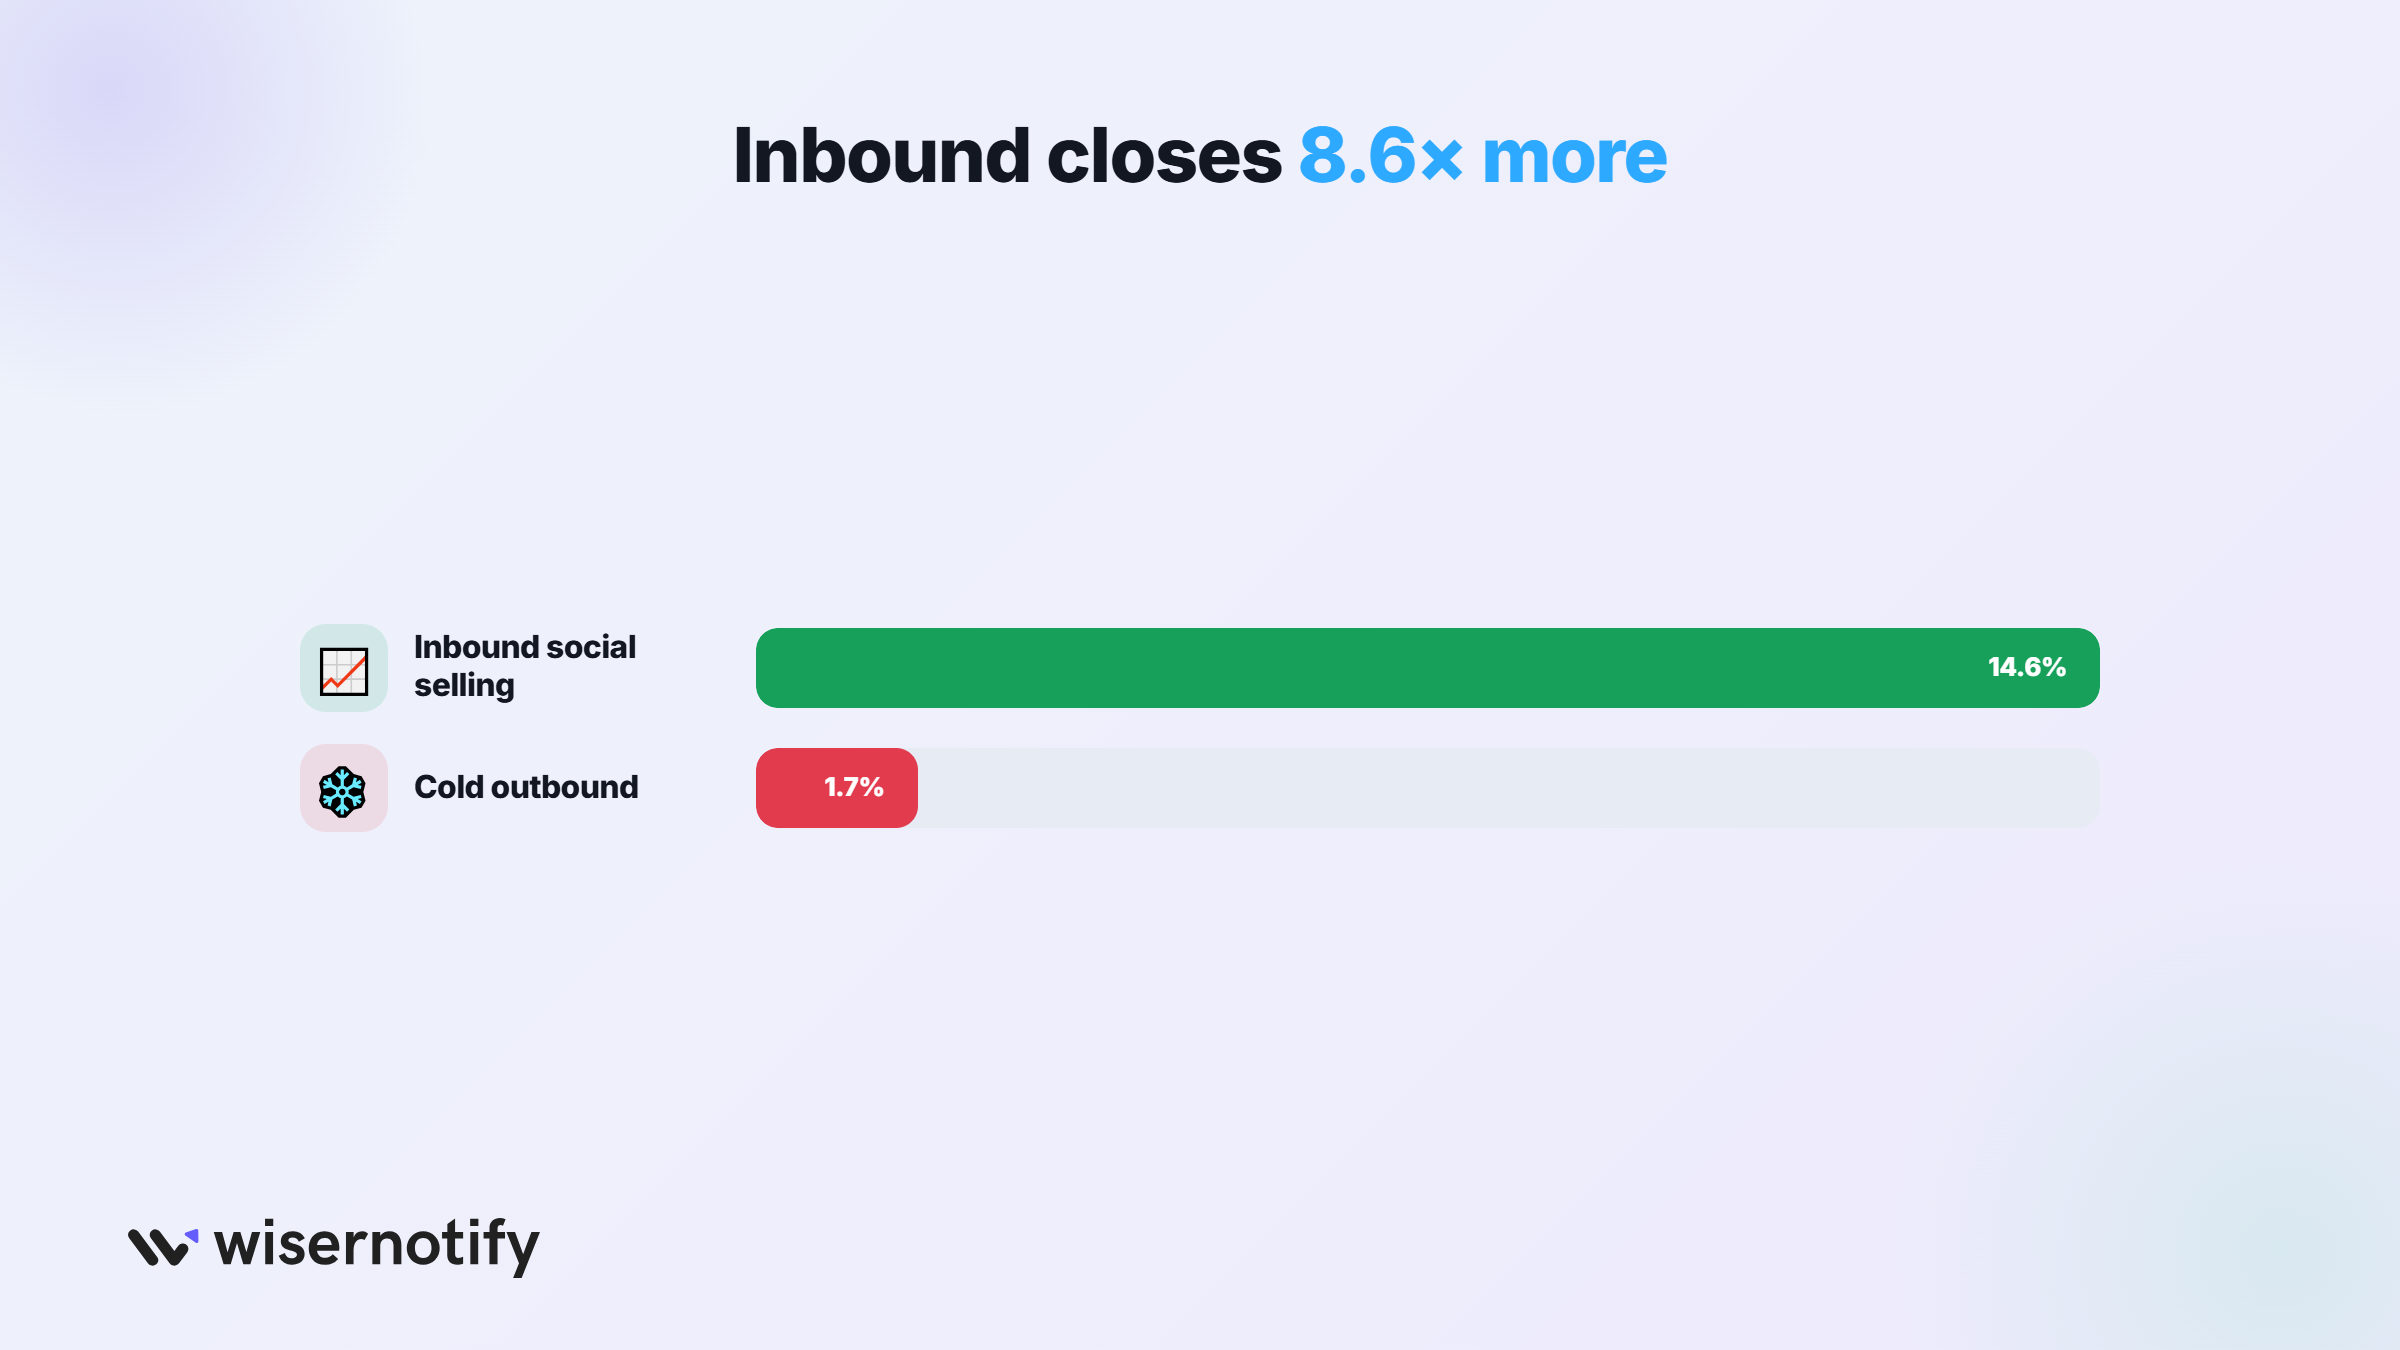
12. Inbound leads generated through authority-based social selling close at 14.6%, compared to 1.7% for pure cold outbound prospecting.
13. LinkedIn InMail response rates typically run between 18% and 25%.
14. LinkedIn ads deliver a visitor-to-lead conversion rate of 2.74%, well ahead of Facebook at 0.77% and X at 0.69%.
15. Generic, unpersonalized outreach on LinkedIn now converts worse than cold email, according to a 2026 study of over 13 million connection requests.
16. Expect 60 to 90 days of consistent activity before meaningful inbound lead flow builds from a social selling strategy.
The math is clear. Cold, generic outreach is getting worse, and warm, personalized engagement is getting dramatically better, the same shift covered in our word of mouth statistics.
Boost Conversion Instantly
Add Social Proof & Urgency to your website
Global Social Selling and Social Commerce Statistics
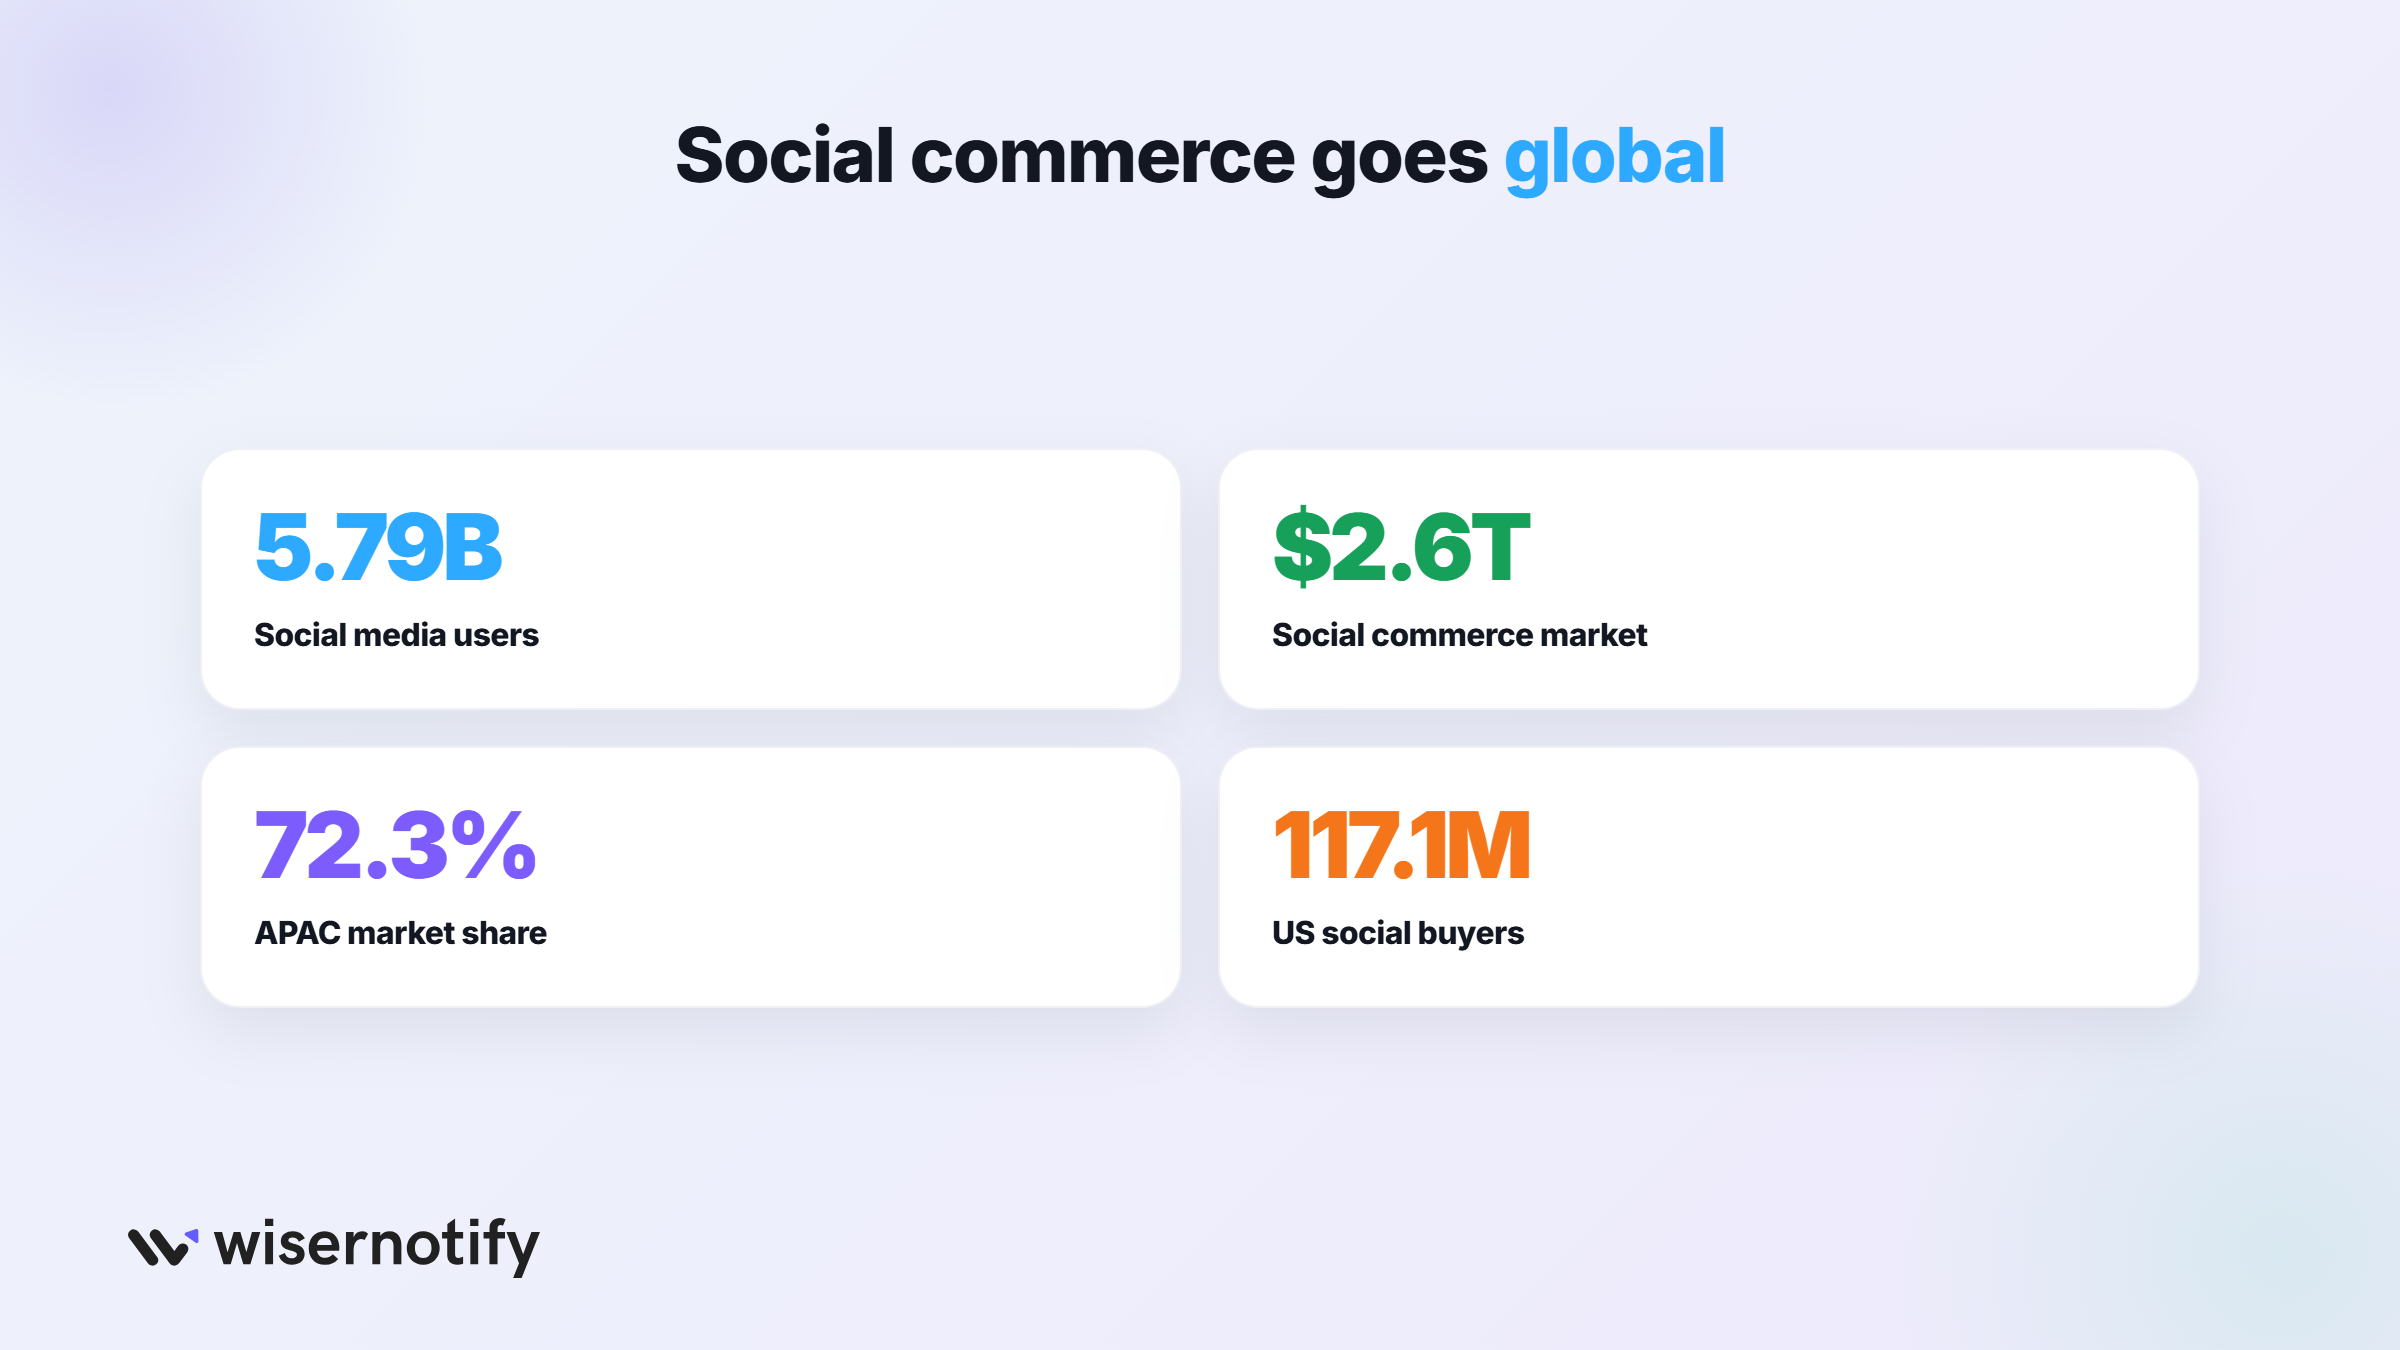
Social selling potential grows directly alongside global social media adoption, and both keep climbing.
17. There are 5.79 billion social media user identities worldwide as of 2026, equal to about 70% of the world’s population.
18. The average person now spends about 2 hours and 21 minutes per day on social media.
19. The global social commerce market is valued at $2.6 trillion in 2026 and is projected to reach $8.5 trillion by 2030.
20. The Asia-Pacific region holds a 72.3% share of the global social commerce market, the largest of any region.
21. Northern Europe leads regional social network penetration at 80.2%, with Western Europe close behind at 78.2%.
22. Southeast Asia alone contributes 31% of all new social commerce buyers worldwide.
23. US social commerce sales are projected to surpass $100 billion for the first time in 2026, an 18% year-over-year increase.
24. US social commerce buyers reached 117.1 million in 2026, about a third of the country’s total population.
No single region owns social selling anymore. Growth is coming from every direction at once, the same global spread covered in our social commerce statistics.
Which Platforms Drive B2B Social Selling?
Platform choice matters enormously in B2B, where LinkedIn’s dominance is not close.
25. 86% of B2B marketing activity happens on LinkedIn, with Facebook a distant second at 79%.
26. 80% of B2B social media leads originate from LinkedIn specifically.
27. 75% of B2B buyers say they use social media as part of their purchasing decision process.
28. 54% of B2B marketers say they generate leads directly from social media.
29. 39% of companies report they have generated real revenue through social selling.
30. Staffing and recruiting firms post the highest LinkedIn connection acceptance rates of any sector, at 36.5%.
LinkedIn’s grip on B2B social selling has only tightened, much like the platform concentration covered in our guide to displaying social posts.
Boost Conversion Instantly
Add Social Proof & Urgency to your website
How Should Teams Build an SSI Score That Converts?
Improving the score and improving pipeline are related, but they are not the same project.
31. Sales Navigator’s saved search and lead list features directly reward the “finding the right people” pillar of the SSI score.
32. AEs at enterprise SaaS companies average an SSI of 45 to 58, while top-quartile performers cluster above 70.
33. SDRs and BDRs average a lower SSI of 35 to 50, since prospecting-heavy roles benefit most from consistent search and outreach activity.
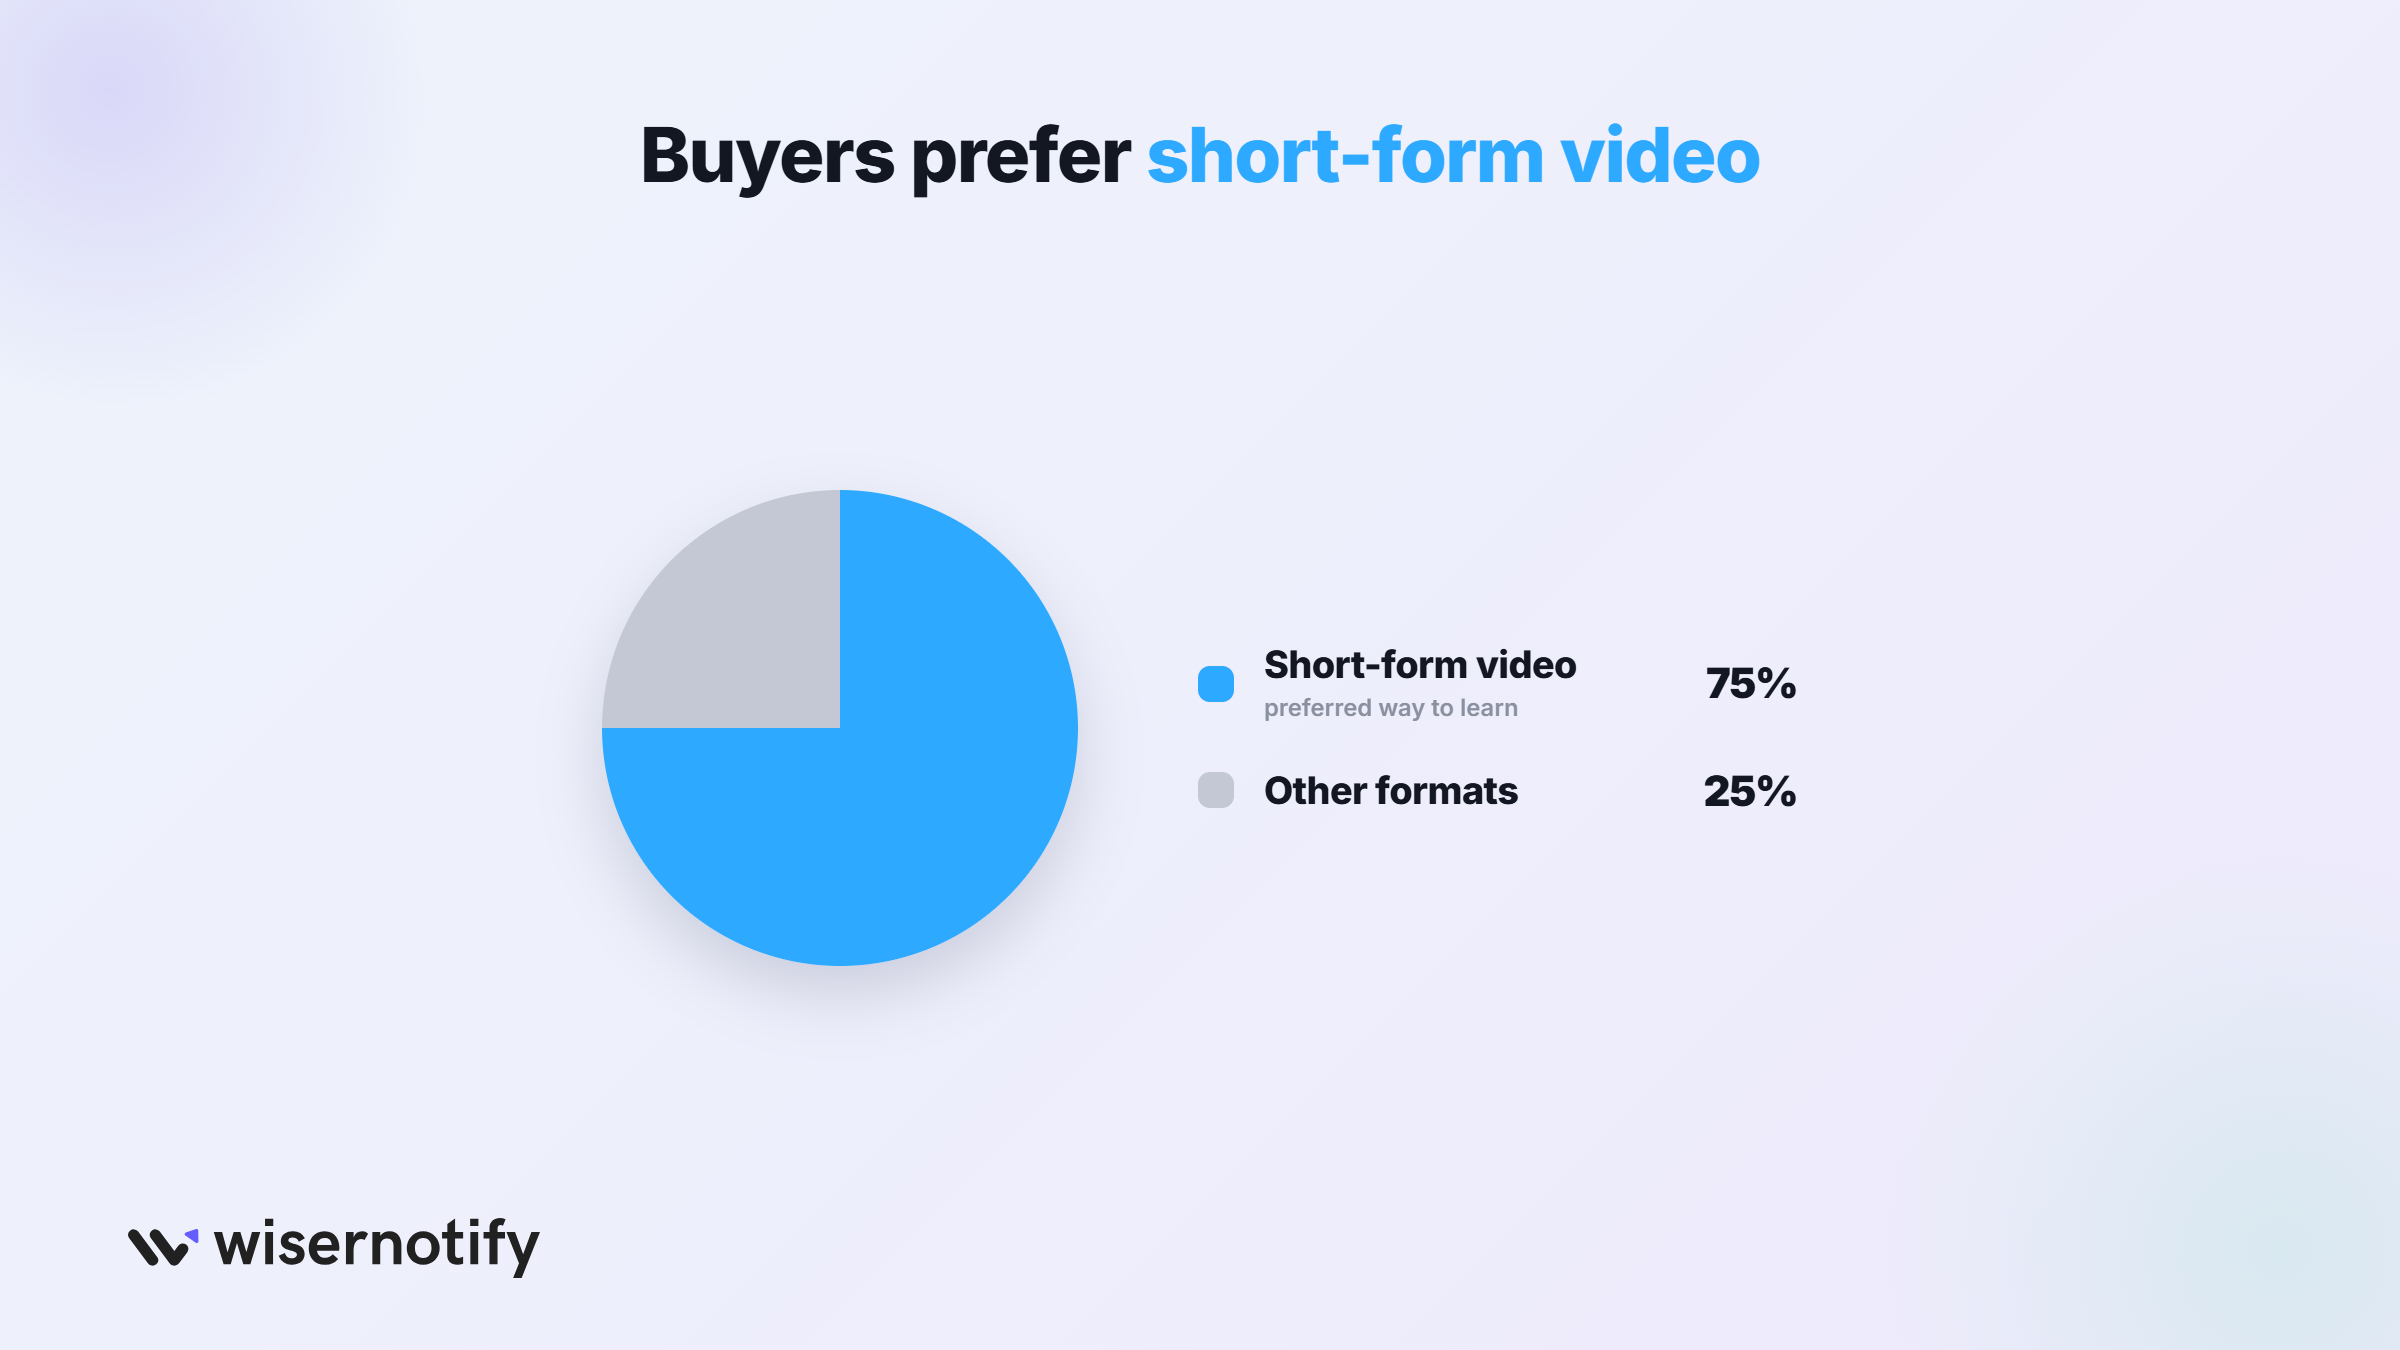
34. 75% of social media users say they prefer learning about a new product through short-form video over other content formats.
35. Consistent posting and genuine engagement, not follower count, are the strongest predictors of a rep’s long-term SSI growth.
A high SSI score is a leading indicator, not the goal itself. The reps who win treat it as a habit tracker for the relationship-building work that closes deals.
How to Use These Numbers
Check your SSI score at linkedin.com/sales/ssi before building a strategy around it. It is free and updates daily, so you can track real progress.
Fix the training gap first. Give reps a specific SSI target, not just a vague instruction to “be more active.”
Pair that with visible social proof on your own site so the trust built on social carries through to the sale.
Boost Conversion Instantly
Add Social Proof & Urgency to your website
Conclusion
Social selling has stopped being optional. Reps who skip it are already falling behind the ones who don’t.
Most teams have the tools already. What they are missing is training and a way to measure whether it is working.
Track the score, close the training gap, and treat LinkedIn as the channel the data already shows it to be. That same trust logic carries over to our online review statistics.
Sources
Martal | Kanbox | ConnectSafely | Gangly | SellersCommerce | SQ Magazine
Frequently Asked Questions
What is LinkedIn's Social Selling Index (SSI) and how does it work?
It runs from 0 to 100, built from 4 pillars worth 25 points each: professional brand, finding the right people, engaging with insights, and building relationships. The average score falls between 26 and 50.
Does a higher SSI score actually lead to more sales?
Reps with a high SSI score generate 45% more sales opportunities and are 51% more likely to hit quota than reps with a low score.
Do I need Sales Navigator to check my SSI score?
It’s free. Every LinkedIn member can check their score at linkedin.com/sales/ssi without a paid Sales Navigator subscription.
How does social selling compare to cold outreach?
Inbound leads generated through authority-based social selling close at 14.6%, compared to just 1.7% for cold outbound prospecting.
Which platform matters most for B2B social selling?
86% of B2B marketing activity happens on LinkedIn, with 80% of B2B social media leads originating from the platform specifically.

Krunal Vaghasiya is a marketing tech expert who boosts e-commerce conversion rates with automated social proof and FOMO strategies. He loves to keep posting insightful posts on online marketing software, marketing automations, and improving conversion rates.




 Capterra