
Black Friday is no longer just a day – it’s a multi-billion dollar phenomenon that continues to break records.
In 2024, a staggering $10.8 billion was spent online in a single day, with the average shopper shelling out $650.
But Black Friday is more than impressive numbers. It reflects our changing consumer behavior, the evolution of retail strategies, and the undeniable power of a good deal.
Uncover 27 Black Friday statistics that will challenge your assumptions and expose the forces fueling this growth.
Grab the deal: Top 38 Black Friday SaaS Deals for 2025
Top Black Friday Statistics
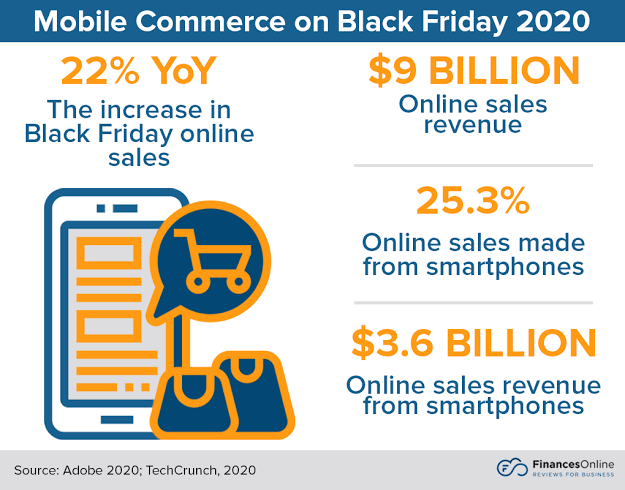
- In the last few years, about 25.3% of Black Friday online sales came from mobile devices.
- In 2023, Black Friday sales in the US reached $9.5 billion.
- In 2024, Black Friday sales in the US reached $40 billion, including $10.8 billion online.
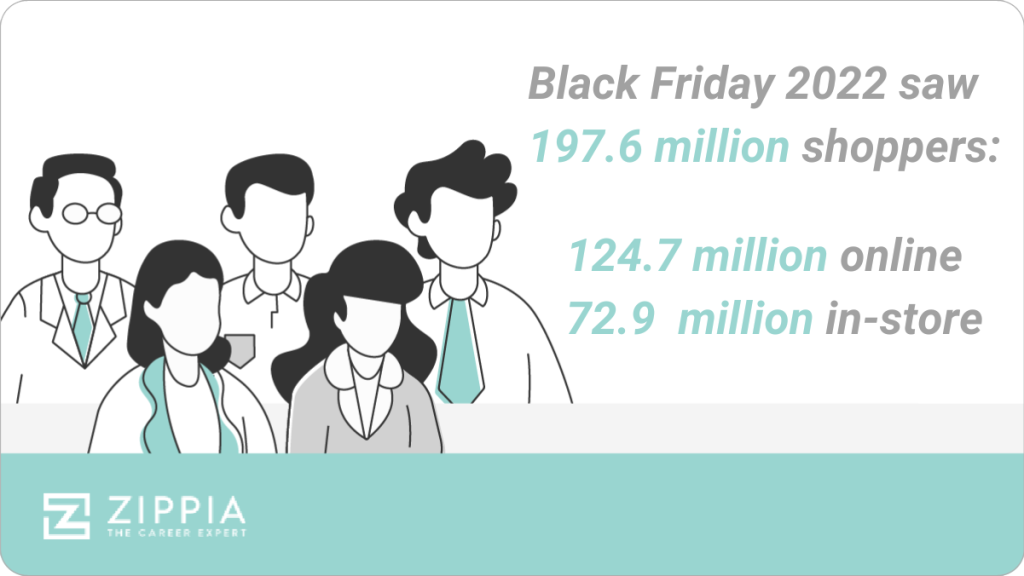
- Around 124.7 million people shopped online during Black Friday weekend in 2022.
- Global Black Friday online sales were over $65.3 billion in 2022.
- The average discount on Black Friday in 2023 was about 31%.
- Many Black Friday shoppers start early, with stores opening as early as 5 a.m.
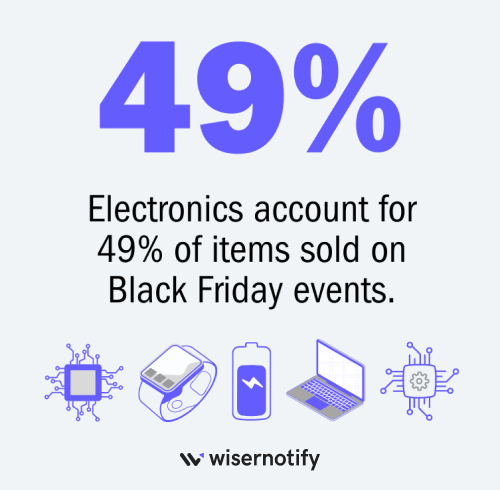
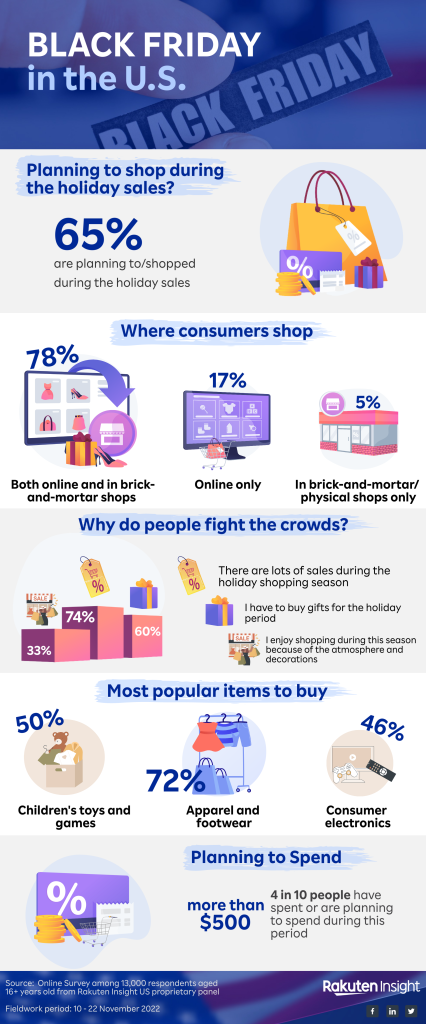
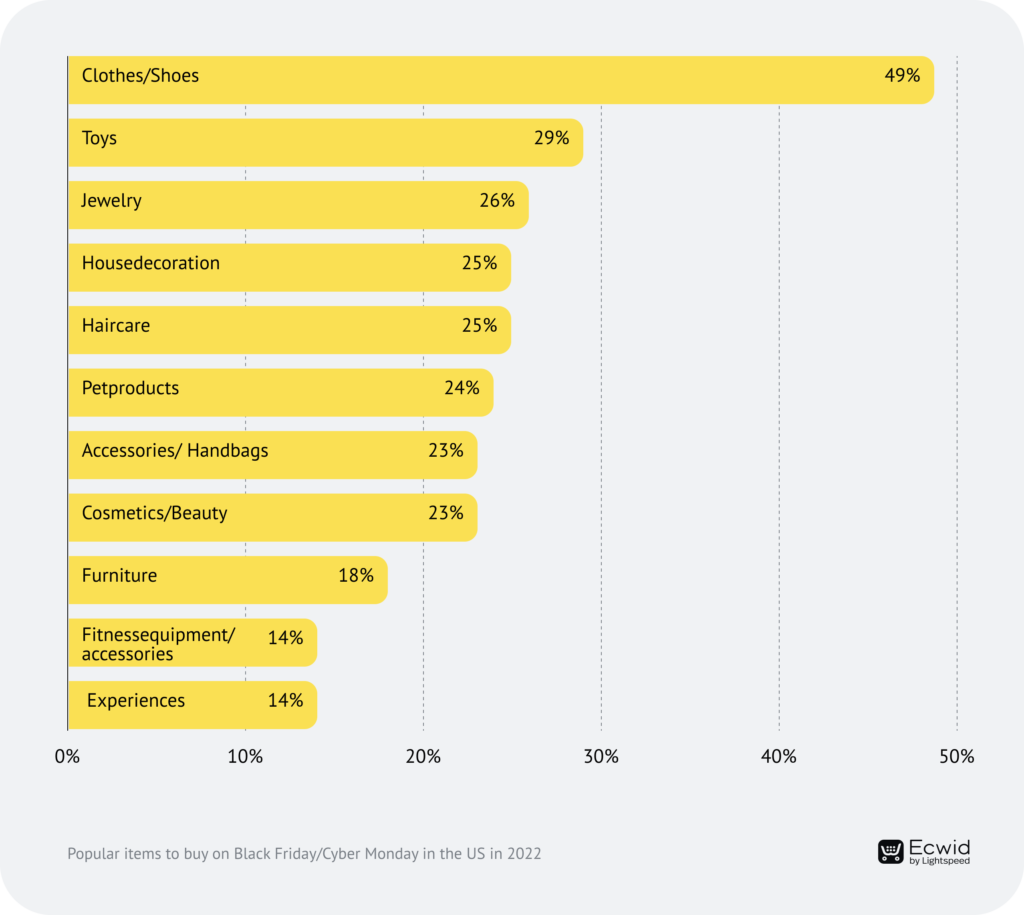
- Popular Black Friday items include electronics (49%), clothing and accessories (72%), and cosmetics (23%).
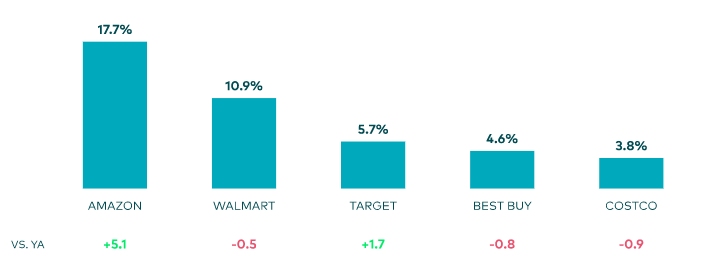
- Amazon made more than 17.7% of all Black Friday sales.
- 64% of consumers will shop online this Black Friday, with 36% seeking deals on social media.
The Evolution of Black Friday
Over the last ten years, Black Friday has changed significantly, largely due to changes in consumer behavior, technological advances, and store strategies.
Initially famous for doorbuster deals and exciting in-store crowds, Black Friday has developed into a large shopping event that includes online shopping, extended sales, and strategic marketing campaigns.
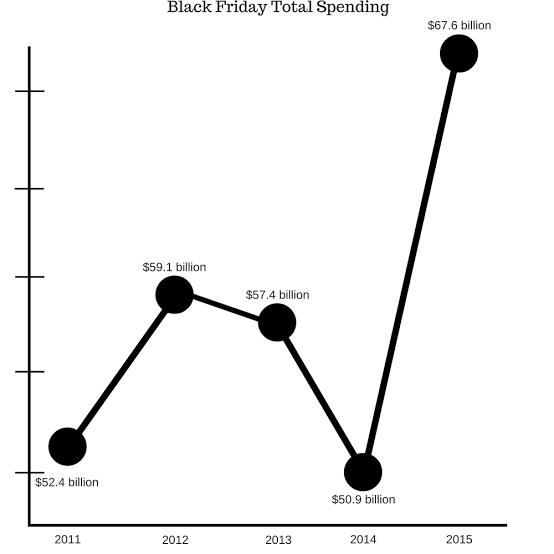
1. In recent years, total spending during the Thanksgiving weekend (including Black Friday) has ranged between $59.1 billion to $72.3 billion.
According to the National Retail Federation, over the last decade, total spending during the Black Friday sales have significantly increased.
2. The estimated spending was $59.1 billion in 2012, which increased to $68.9 billion in 2019 and up to $70 billion in 2020, further underscores the market importance of Black Friday for retailers and business owners.
At the onset of the decade, Black Friday was mainly focused on the physical stores where customers lined up outside shops hours before opening to buy electronics, clothes, and other limited-time items at discounted prices.
The urgency and thrill of in-store shopping remained, but gradually, with the advancement of technology, online shopping started taking shape.
The focus slowly shifted toward e-commerce platforms, offering early access to discounts and flash sales, which lured in digital customers.
3. Online sales on Black Friday weekend have experienced significant growth, with approximately 124.7 million online shoppers in 2022.
According to an Adobe survey, online Black Friday sales have consistently increased over the last decade due to a shift of focus towards e-commerce by retailers and shop owners.
4. In 2010, online sales accounted for 6.4% of total Black Friday sales, rising to 19.7% in 2017 and then to 29.3% in 2020.
Businesses accommodate the changes resulting from customer behavior and technology, leading to new dimensions of Black Friday as one of the primary events in commerce history through which social shifts are reflected.
Why Black Friday Matters
Black Friday is very significant to retailers and buyers alike. Retailers see it as a golden opportunity to increase annual sales, clear inventory, and attract new customers through heavy discounts on their products.
It can have a profound effect on the business’s bottom line, as it determines how well the business performs during the holiday season in terms of profitability.
Conversely, shoppers look forward to the Black Friday shopping event to buy high-end items, electronics, and gifts at low prices.
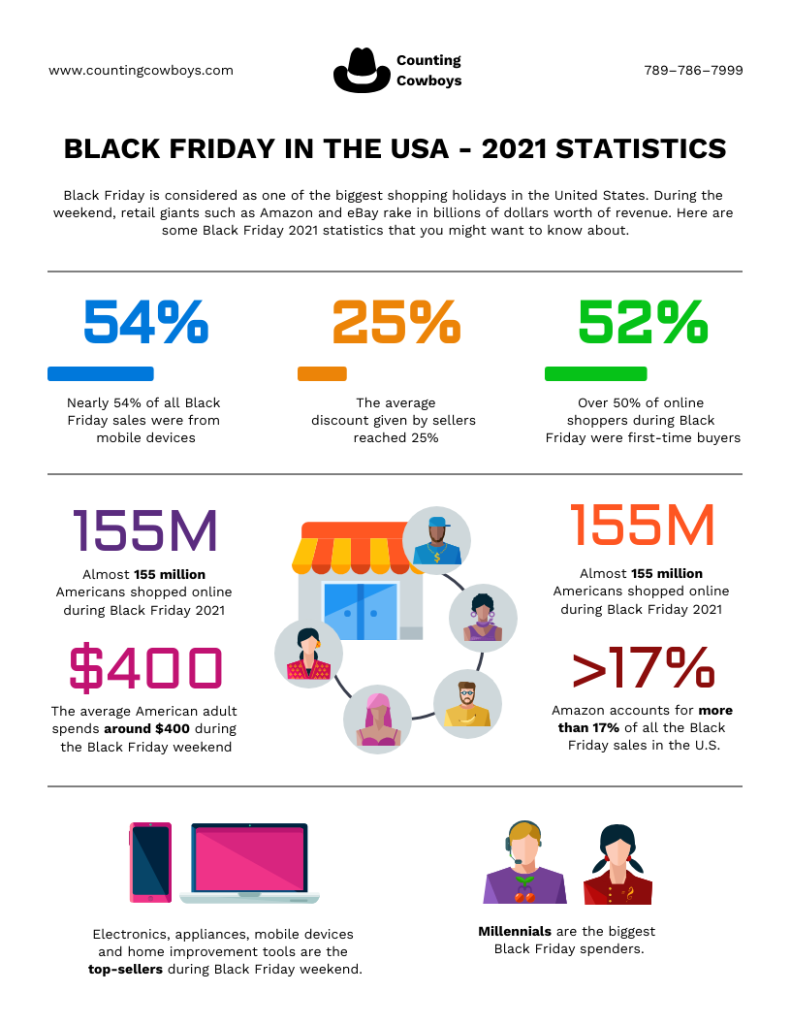
5. The average customer spent approximately $400 on a Black Friday weekend in 2021.
The enormous discounts attract fierce competition among store owners, thus promoting a dynamic shopping environment.
Moreover, beyond saving on purchases, Black Friday has become a cultural phenomenon that molds customer behavior and shopping habits.
Also see: Cart Abandonment Statistics: $18 Billion in Annual Losses
This makes Black Friday important for both retailers who want profits and customers seeking value.
Build trust & FOMO
Highlight real-time activities like reviews, sales & sign-ups.


Key Black Friday Stats
6. During the Thanksgiving weekend of 2008, total spending in the US was around $41 billion.
7. Aggregate expenditures made in the US over Black Friday weekend reached approximately $69 billion this year, $71 billion in 2021, and $75 billion in 2023.
2020 was notable for an accelerated switch towards e-commerce due to the COVID-19 pandemic, which affected consumer behavior and shopping preferences.
The growth of online sales continued compared to in-store purchases. 2023 saw an increase in both online and in-store purchases during the holiday season.
Online vs. In-Store Sales Over Time
Over time, Black Friday sales trends have significantly changed, with a shift from mainly in-store purchases to online shopping.
In the beginning, most of the stores were physical ones full of people during the Black Friday season.
They were attracted to all the amazing deals and discounts, but e-commerce turned everything around.
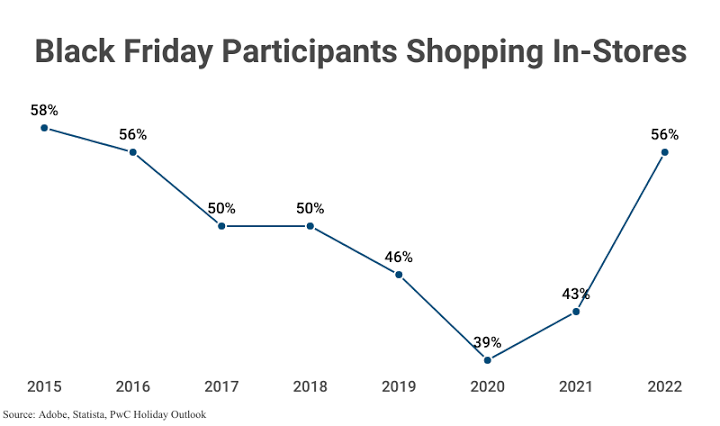
8. During the early 2000s, in-store purchases dominated, with brick-and-mortar stores having almost 90% of Black Friday sales.
The comfort, wider variety, and comparability of shopping on the internet continued to tempt customers away from shops.
This was quickened by mobile shopping apps and internet infrastructure.
9. In-store sales declined from the late 2010s to the early 2020s but accounted for almost 70% of total Black Friday sales.
10. In the last few years, mobile devices accounted for about 25.3% of online sales on Black Friday.
Mobile phones have contributed significantly to customers’ online spending and have thus played a role in changing trends.
On the one hand, traditional buying is still enjoyed by thousands of Black Friday shoppers who are looking for immediate satisfaction and tangible experiences.
On the other hand, online Black Friday sales have grown exponentially, indicating a wider movement toward digital commerce and changing customer preferences for convenience and accessibility.
11. In-store shops adapted to changing trends during the mid-and late 2020s, comprising about 50% of total Black Friday sales, while online sales increased to more than 50%.
Top-Selling Products & Categories on Black Friday
During the shopping season, Black Friday shoppers spend most on electronics, such as smartwatches, smartphones, laptops, televisions, and beauty products.
Many people flock to stores and online platforms to buy these items.
12. Electronics account for 49% of items sold on Black Friday events.
Following electronics, consumers spent most on fashion and apparel, and famous brands and seasonal items saw a rise in sales.
Build trust & FOMO
Highlight real-time activities like reviews, sales & sign-ups.

Related read: 55 Cyber Monday Statistics (A 73-Year History)
13. People shop in stores for clothes and apparel, and they make up around 72% of products bought, followed by athletic wear with a 10% to 15% contribution in sales.
Home appliances like smart home appliances and kitchenware are very popular amongst buyers since they attract shoppers with heavy discounts.
14. Kitchen appliances contribute 10% to 15% to total Black Friday sales, followed by vacuums and cleaning devices, which account for 5% to 10% of total sales.
Beauty products have special Black Friday deals and hold a significant share of the market, which attracts more shoppers.
15. Cosmetics hold almost 23% of total Black Friday purchases, followed by haircare appliances and products, which make up around 5% of total sales.
Black Friday Consumer Shopping Statistics
Black Friday statistics unveil a number of interesting facts about consumers’ attitudes during this much-awaited event. Let’s have a look.
Build trust & FOMO
Highlight real-time activities like reviews, sales & sign-ups.

How Many Shoppers Participate in Black Friday
Millions of shoppers willingly participate in both in-store and online shopping on Black Friday, making it a very busy retail season.
This holiday shopping event is driven by customers’ desire to obtain goods at a lower price and limited-time offers, turning streets and websites into crowded dens of activity.
Retailers go to great lengths to handle this rush, thereby enabling clients to get a perfect shopping experience throughout the Black Friday fever.
16. According to NRF surveys, about 147 million people participated in Black Friday in recent years, including both online and in-store shoppers.
When Do Shoppers Start Their Black Friday Shopping?
Shoppers normally start their Black Friday shopping as soon as or possibly before the holiday season starts.
Therefore, stores open at midnight or have earlier online bargains. This appears to be the trend year in and year out.
These days, many businesses open way earlier than they used to so that shoppers can purchase all sorts of items at low prices.
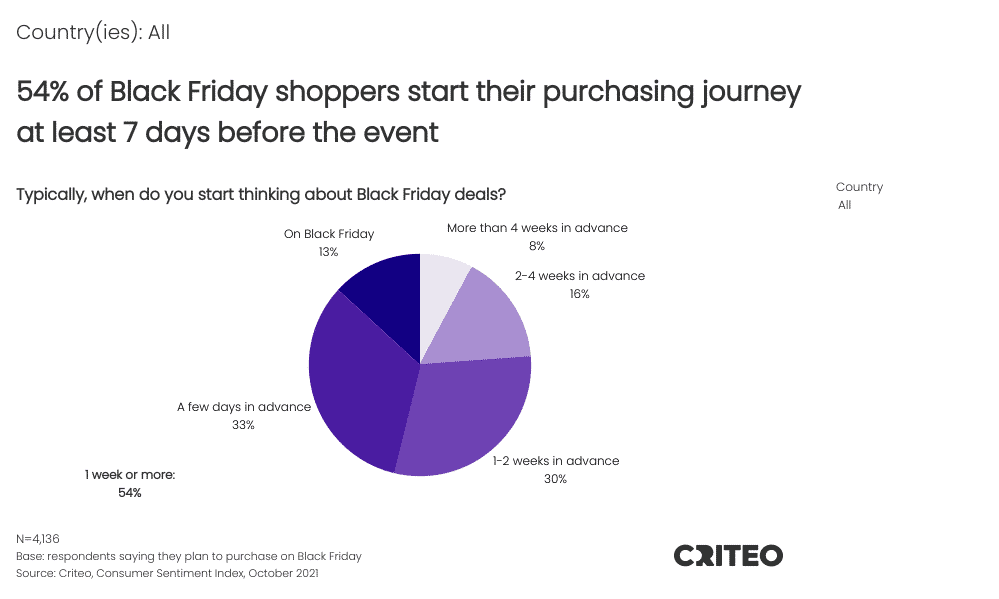
17. Many consumers shopped in advance before the holiday shopping season actually started, with about 54% starting at least 7 days before the event.
Many customers make impulsive buying decisions, while others plan ahead by looking at sales and strategizing about the stores to save maximally.
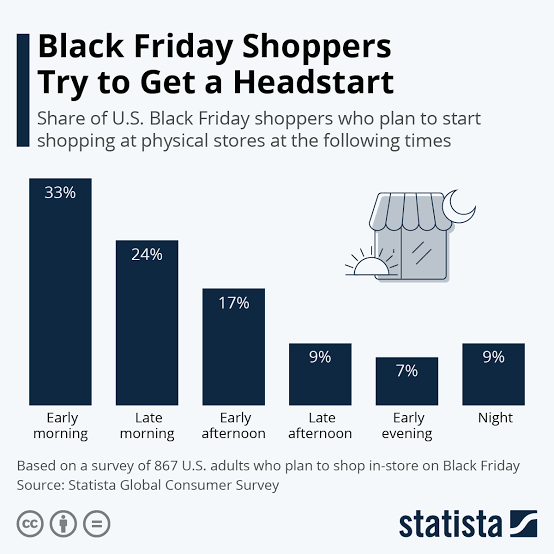
18. Up to 33% of 33% shoppers do their Black Friday shopping as early as early morning.
Demographic Breakdown of Black Friday Shoppers (Age, Gender, Income)
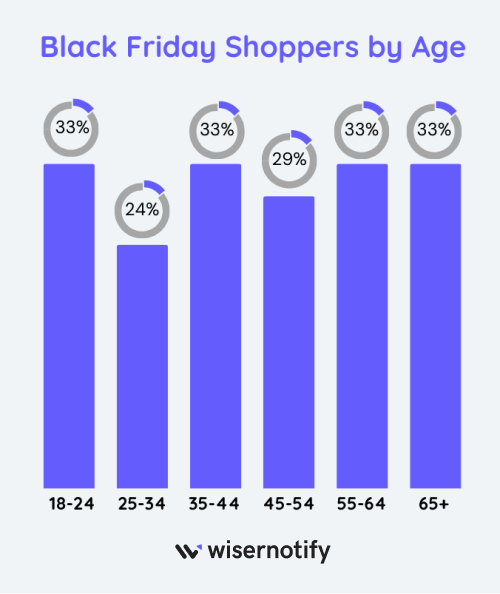
Millennials (25-34) are the most common buyers due to their attraction to electronic and fashion items, whereas older people also participate in this event, typically baby boomers and customers with children who have an interest in home appliances and gifts.
19. On Black Friday, millennials account for 24% of shoppers, whereas middle-aged people constitute about 33%.
Both men and women equally participate in this event, but females often outnumber male shoppers during this period because they usually shop ahead of holidays.
Women mostly buy beauty products and apparel, while men are more interested in electronics and sporting goods.
20. Women constitute the majority of Black Friday shoppers, with an average of 62%, whereas men make up 50% of shoppers.
Most consumers are middle-income groups that make up a large proportion of Black Friday shopping events.
However, some high-income levels are somewhat represented. They focus on luxury and high-end items and travel packages.
Build trust & FOMO
Highlight real-time activities like reviews, sales & sign-ups.

Black Friday Statistics in Specific Contexts
Black Friday statistics are important since they offer a comprehensive picture of how retailers and consumers are affected by Black Friday.
Let’s know about some specific parameters of Black Friday stats.
Black Friday Email Marketing Stats
Email marketing campaigns conducted on Black Fridays have increased customer participation.
Compared to the previous year, click-through rates typically increase twofold or threefold, boosting sales.
21. Email open rates increase compared to normal days by almost 30%.
You can learn more about getting more opens with black friday email subject lines in this blog.
22. Click-through rates increase by 35% during Black Friday, indicating high engagement levels.
Conversion rates also increase considerably, demonstrating the value of targeted promotions and appealing offers during the peak shopping period.
Personalization and segmentation strategies are important.
You can also checkout: 50+ Ecommerce Personalization Statistics & Trends
Metrics show that early promotions attract more attention and interaction than last-minute ones.
Also see: 25 Black Friday Email Examples That Work Like a Charm
Black Friday for Small Businesses
For small businesses, Black Friday is a game changer when it comes to escalation and increased visibility. T
hese smaller market players can outshine their larger counterparts by providing unique items, personalized services as well as competitive discounts.
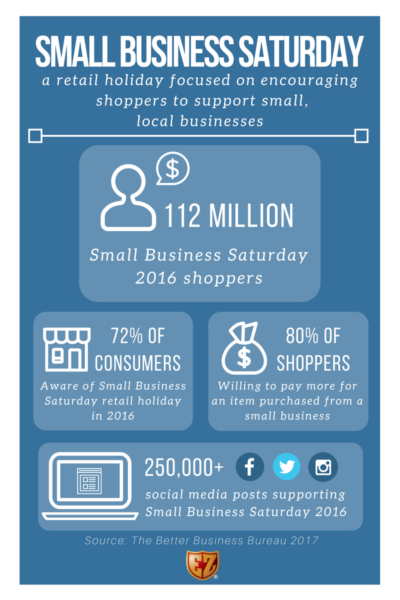
23. Small business saturday generated around 112 million total revenue for small businesses in 2016.
By doing this, these companies increase their chances of building a client base that goes beyond the Christmas shopping season.
Amazon Black Friday Statistics: The E-commerce Giant
Amazon’s dominance in e-commerce is clearly demonstrated by Black Friday, with astounding sales figures that break records every year.
The platform’s vast collection of goods, reasonable prices, and Prime membership benefits help attract millions of consumers around the world.
24. Amazon accounts for more than 17.7% of all Black Friday sales.
It is good to mention that mobile shopping is increasing, and the Amazon app plays a significant role in this.
Prime Day’s incorporation extends Black Friday’s frenzy for days.
Boost Conversion Instantly
Add Social Proof & Urgency to your website
Environmental Impact of Black Friday
25. Black Friday sales in the UK alone have released 386,243 tonnes of carbon. That is the same as the amount of CO2 created by 215 flights from London to Sydney.
26. Additionally, it’s claimed that 80% of the goods we purchase are burned or landfilled after a relatively little lifespan.
27. 63% of those who are drawn to making impulsive Black Friday purchases
Wrap up
This year’s Black Friday statistics reveal a fundamental truth: the power rests firmly in the hands of the consumer.
Shoppers are no longer passive participants; they are informed, discerning, and willing to vote with their wallets.
For retailers, this means more than just offering discounts. It means crafting personalized experiences, prioritizing value, and fostering authentic connections that go beyond the transaction.
Sources
WebFx | Zippia | Reuters | SlidePlayer | Statista | Phys | Money.co.uk
Also read: Black Friday History: Origins, Evolution & Impact on Shopping
