Online shopping has grown a lot and revolutionized the way we buy.
The numbers are staggering and will absolutely blow your mind.
With over 2 billion digital shoppers worldwide, the e-commerce business keeps growing.
The reasons are endless. From social media influence to sustainable shopping, the trends are shaping up to transform the way we shop, sell, and interact.
This article provides you with a list of online shopping statistics and trends, where only a click of a button can change the dynamics.
Build trust & FOMO
Highlight real-time activities like reviews, sales & sign-ups.
Top Online Shopping Statistics
Online sales went up by 43% in 2020 because of the pandemic.
Almost half of China’s shopping is done online.
More people in India will shop online, increasing from 22.1% to 34% by 2029.
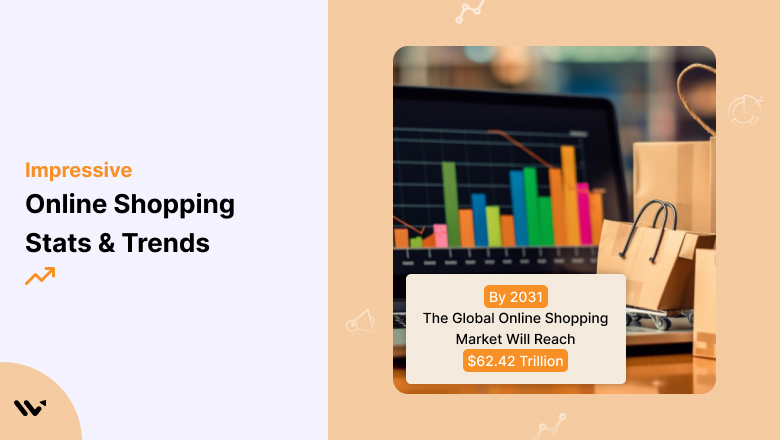
The global online shopping market will be worth $62.42 trillion by 2031.
The UK’s online market will reach $217.5 billion by 2028.
Gen Z has $450 billion to spend.
55% of Gen X shoppers want easy payment methods.
Second-hand fashion sales will reach $350 billion by 2027.
Consumer electronics online sales grew from $614.98 billion in 2023 to $701
Online Sales and Revenue
1. Global retail e-commerce sales are projected to reach $9 trillion by 2032, indicating continued growth and dominance in the retail sector.
2. China had the highest internet sales in 2023
As the world’s largest e-commerce market, China saw the highest internet sales in 2023, making up almost half of transactions.
Indonesia stood second with the highest share of retail e-commerce sales, and the UK and South Korea had sales just over the 30% mark.
3. Number of e commerce users in India will reach 501.6 million in India
By 2029, the number of ecommerce users in India has been predicted to reach 501.6 million, with a significant increase in user penetration from 22.1% in 2025 to 34.0% in 2029.
Additionally, the Average Revenue Per User is expected to reach $190, which means that there will be substantial growth in the e-commerce market.
4. As for the online shopping statistics for 2025, 33% of the world’s population is shopping online.
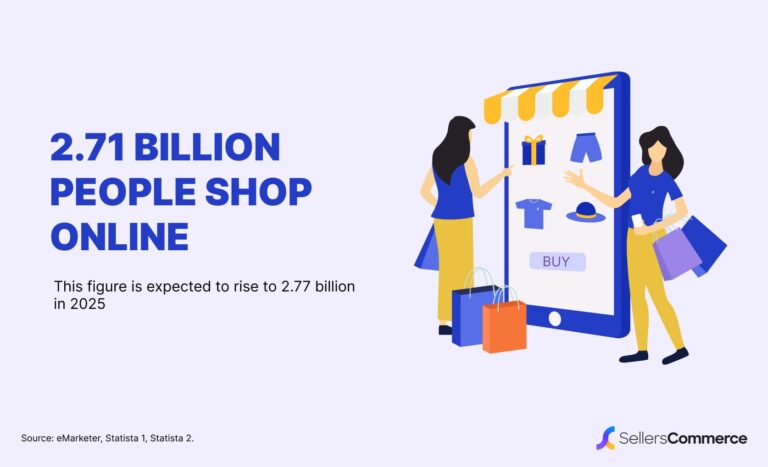
This is a 2.7% year-on-year growth, which shows the rapid expansion of e-commerce
5. The ecommerce market is expected to grow at a CAGR of 7.8% from 2025 to 2027, ultimately reaching $8 trillion by 2027.
This growth rate surpasses that of physical stores by more than two times.
Here is more: 100+ ECommerce Statistics & Trends
Overall Market Size
6. The global ecommerce market is expected to reach $62.42 trillion.
The global e-commerce market’s value increased from $24.03 trillion in 2019 to $26.67 trillion in 2023.
This growth is expected to continue, with the market projected to expand at a CAGR of 11% between 2025 and 2031, ultimately reaching a staggering $62.42 trillion by 2031.
7. By 2030, the Indian e-commerce industry is expected to have its gross merchandise value (GMV) surpass $350 billion.
8. The market size of the UK is expected to reach $217.5 billion by 2028
The UK e-commerce market’s growth is projected with an increase of 7.7% to reach $169.5 billion by the end of the year.
This increase is expected to continue, with a CAGR of 6.4% from 2025 to 2028, ultimately reaching a market size of $217.5 billion by 2028.
9. India’s e-commerce market witnessed a significant growth of $65 billion in 2022. The market is supposed to reach $380 billion by 2030.
10. In 2021, China had the highest global e-commerce market, leading 56.7% of total shares.
Build trust & FOMO
Highlight real-time activities like reviews, sales & sign-ups.
COVID-19 Pandemic Impact on Online Shopping
The COVID-19 pandemic turned out to be a catalyst for ecommerce sales
11. The COVID-19 pandemic acted as a catalyst for online shopping, with 2020 seeing a 43% increase in online sales due to lockdowns and social distancing measures, which was a whopping $244.2 billion increase.
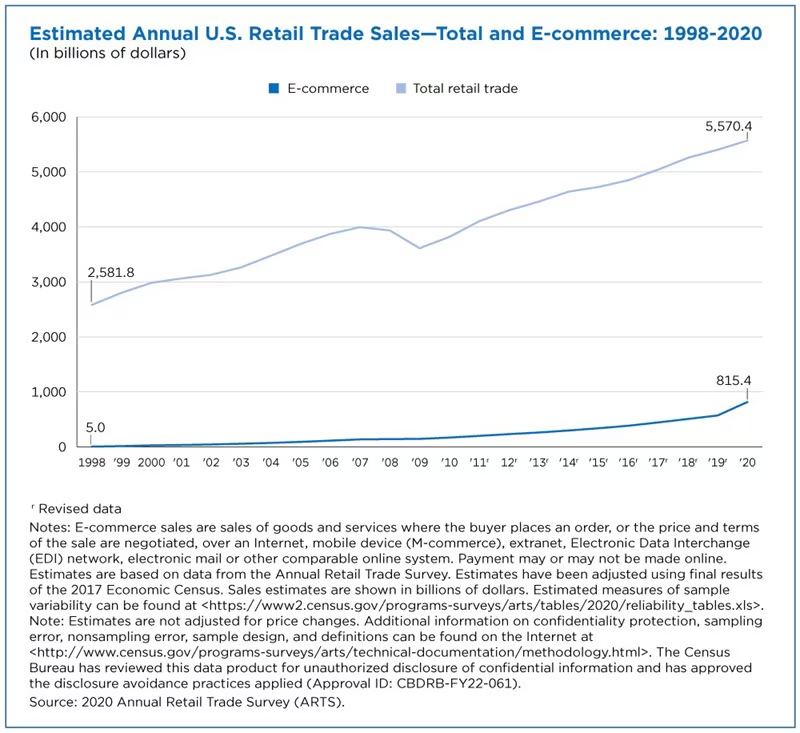
12. It increased from $571.2 billion in 2019 to $815.4 billion in 2020.
13. The COVID 19 pandemic significantly influenced the rise of sales in ecommerce in Europe with a 66% increase from 2019 to 2021.
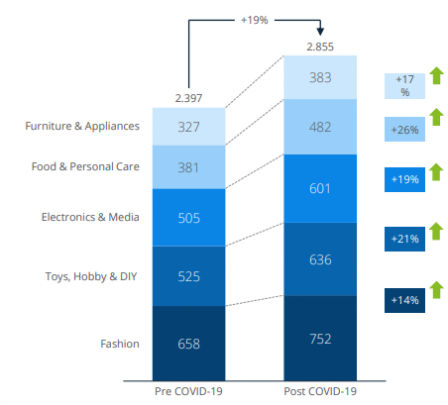
14. Global ecommerce revenue is projected to have increased by 19% in 2020, comparing pre-pandemic and post-pandemic periods, indicating a significant acceleration of online shopping due to the impact of the COVID-19 pandemic.
15. In 2020, worldwide e-commerce sales reached a staggering $26.7 trillion due to the $26.7 trillion, due to COVID-19 pandemic and became a milestone for the growth of online shopping.
Abandoned Cart Statistics
16. According to Baymard Institute, 48 shopping cart abandonment studies show that the average cart abandonment rate is 69.99%.
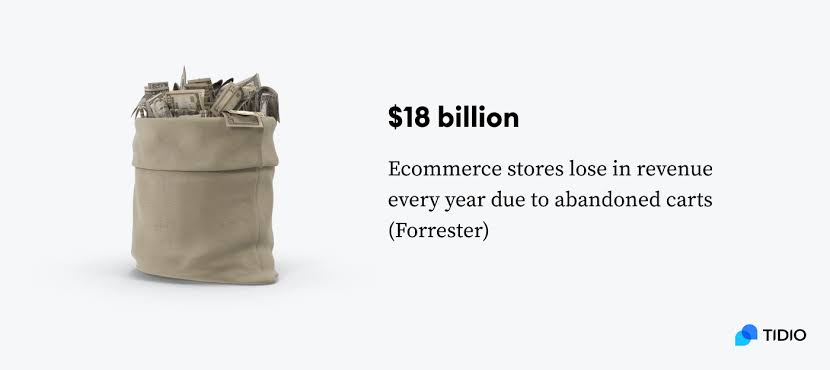
17. Research indicates that $18 billion in annual sales revenue is lost to cart abandonment every year in annual sales revenue is lost to cart abandonment every year says, research, according to Forrester.
18. By addressing cart abandonment issues, ecommerce businesses can potentially save $260 billion in lost revenue.
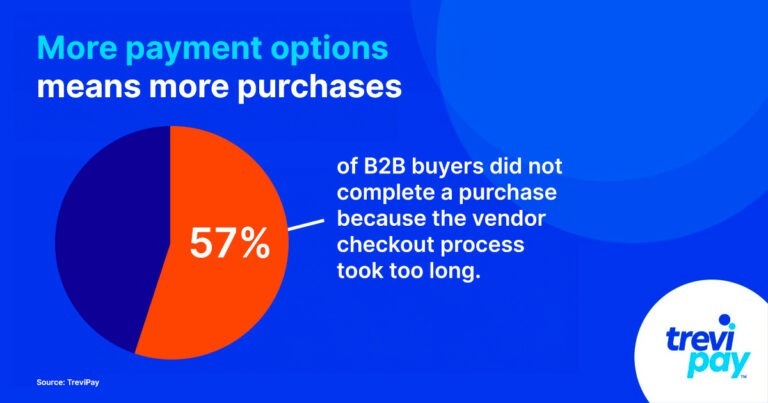
19. More than half, that is, around 57% of B2B online shoppers, abandon their purchases due to lengthy and inefficient checkout processes offered by vendors.
20. The Caribbean has the highest rate of cart abandonment, which is 92.2%, while the Asia-Pacific region has the lowest rate, with 76.3%.
Read more? Here you go: Cart Abandonment Statistics: $18 Billion in Annual Losses
Build trust & FOMO
Highlight real-time activities like reviews, sales & sign-ups.
Top Product Categories in Online Shopping
Online shopping has revolutionized the way people shop and purchase goods.
With the rise of technology and the internet, consumers can now browse and buy products from the comfort of their own homes, 24/7, with several product categories.
Categories like fashion, food, electronics, home, skincare, childcare, health, sports, and much more can be found in online shopping categories.
Here are the online shopping statistics for a few of those:
Fashion
21. In 2023, the global fashion e-commerce market was expected to reach $820 billion dollars, and it is now expected to reach over $1.2 trillion by 2027.
22. Globally, online shopping accounts for 20.5% of all fashion retail e commerce sales, generating all revenue of around $357.4 billion.
23. Second hand market sector is expected to reach $350 billion by 2027
The global demand for second-hand fashion items has seen a rise, with the resale market experiencing a remarkable 28% growth in 2022.
This trend is expected to continue, with the industry projected to reach a value of $350 billion by 2027.
The secondhand apparel market has grown eight times faster than the entire apparel sector.
24. A report by McKinsey predicts that generative AI will likely significantly impact the fashion industry, generating an additional $150 to 275 billion over the next five years.
25. The fashion and apparel website visits between 2022 and 2023 showed a 0.56% increase, a 0.56% increase, increase which was higher than any other retail sector.
Electronics
26. The consumer electronics e-commerce industry worldwide was $244 billion in 2023. And this market size is expected to exceed $397 billion by 2029.
27. In 2022, the electronics industry achieved a milestone of generating nearly $1 trillion in global revenue.
28. Online buyers of age 34 and under make up 47% of all electronics sales, whereas only 6% of electronics sales are made by shoppers over 65.
29. Online shopping statistics show that online sales managed to grow from 2021 to 2022 by 0.3% for consumer electronics e-commerce.
30. 14% CAGR in the growth of electronic goods ecommerce
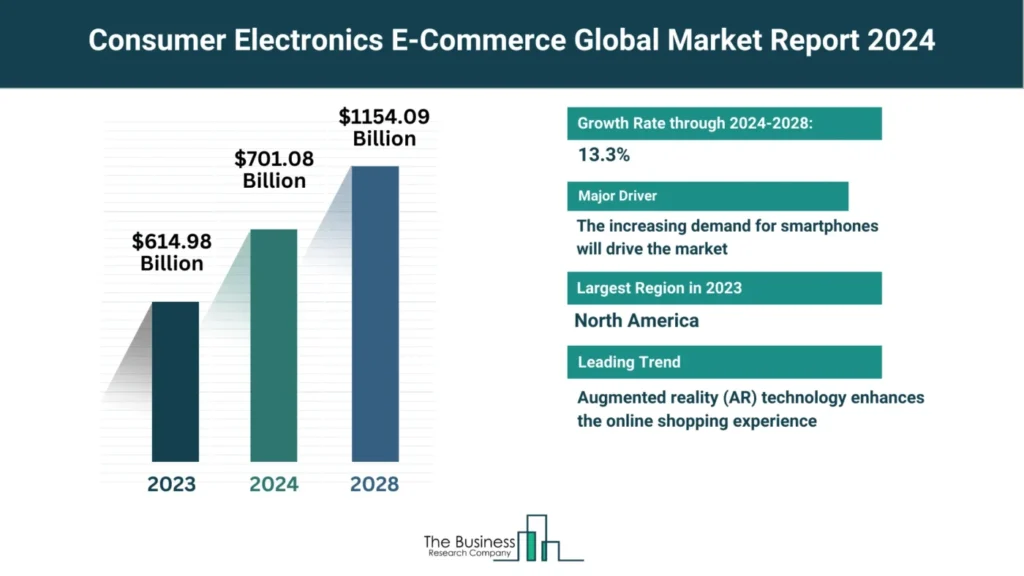
The online shopping industry for consumer electronics rose from $614.98 billion in 2023 to a forecasted $701.08 billion in 2025, representing a 14.0% CAGR and demonstrating the rapid shift towards online shopping for electronic goods.
Beauty
31. Online shopping statistics show that the market size of the online beauty and personal care industry in India was valued at $3 billion in the year 2020 and is expected to reach $6 billion by 2025.
32. According to a 2023 survey, around 46% of shoppers in the United States were purchasing beauty products through online channels.
33. A survey of online shopping statistics shows that more women purchase beauty products than men. An average of 38% of women worldwide purchased beauty products from April to June 2023.
34. 46% of consumers who shop online and purchase beauty products are from the US, making it the highest in the second quarter of 2023.
35. Cosmetics and beauty make up nearly $100 billion in the US, and in the current year, it is expected that more than one-fifth of those sales will come from e-commerce.
Online Shoppers Statistics
The online shopper’s statistics highlight the growing importance of online shopping, the role of mobile devices and social media, and the importance of reviews by friends, families, and even strangers.
Here are the online shopping statistics by generation:
Gen Z
36. 56% of Gen Z consumers in the United States prefer the convenience of online shopping rather than visiting physical stores.
37. GenZ represents a total of $450 billion in spending power
Although they have yet to reach their peak economic influence, Gen Z already has significant purchasing power, with their spending potential in the United States alone reaching up to a total of $450 billion, making them important to e-commerce$450 billion and e-commerce sales worldwide.
38. Almost one-third of Gen Z consumers, that is 29%,29% are more inclined to make a purchase from brands with strong social media presence.
39. Around 60% of Gen Z in the US rely on Instagram to discover new brands, products, and services.
40. Around 22% of visitors to Etsy and Amazon sites were between 18 and 24 years old when an age demographic was examined.
Build trust & FOMO
Highlight real-time activities like reviews, sales & sign-ups.
Millennials
41. Millennials will account for one-third of the global spending on social media platforms by 2025.
42. The majority of millennials, comprising over 54%, have started making their shopping purchases on online platforms.
43. By 2020, millennials’ purchasing power in the United States significantly impacted the retail market, with their spending comprising 30% of the country’s total retail sales.
44. 45% of millennials agreed that they prefer buying online so that they can compare products and prices before purchasing.
45. Most millennials, that is, 61%, prefer to contact retailers through digital means like texting, online chat, or messaging apps instead of visiting a physical store.
Gen X
46. The survey showed that more than half of Gen X shoppers want better payment options
A recent global survey done in the second quarter of 2023 found that 55% of Gen X online shoppers want e-commerce websites to improve seamless and hassle-free payment options, making it easier and faster to complete online purchases.
47. According to a study by Worldpay from FIS, 51% of Gen X consumers have made a purchase directly through social media.
48. A report by Hubspot shows that most Gen X consumers prefer to purchase products offline, but when they do buy online, 53% prefer big box retailers like Amazon.
49. 25% of Gen X shoppers prefer to shop directly on a company’s website, while a smaller percentage of 13% opt for purchasing on social media apps.
50. 37% of Gen X shoppers said that they preferred shopping online since it helped them avoid impulsive purchases they usually make in physical stores.
Boomers
51. General online shopping statistics show that in the past few years, approximately 90% of boomers used online shopping to purchase items as their most convenient way.
52. According to an NPD Group report, boomers contributed about 20% of the total sales of online apparel during the past few years.
53. Nearly half, that is, 49% of boomers, spend at least 11 hours a week online,49% of boomers spend at least 11 hours a week online which also contributes to their shopping.
54. While maximum boomers preferred buying in store, 22% also chose online shopping as their primary method for purchasing.
55. Over 60% of boomers have experience in making online purchases, and 47% of boomers have been spending more on online purchases since COVID-19.
Black Friday Statistics
56. In 2023, global online sales on Black Friday grew 8% compared to the previous year, reaching a record $70.9 billion.
57. Online retail sales in the United States on Black Friday saw a significant 9% year-over-year increase, totaling $16.4 billion.
58. According to Adobe, Black Friday generated $9.8 billion in online sales in the United States, representing a 7.5% increase compared to the previous year.
59. During the entire Holiday Season, online retail sales experienced a significant 6.3% year-over-year growth, much more than in-store sales which saw a more modest 2.2% increase.
Here is more: 24 Impactful Black Friday Statistics
Cyber Monday Statistics
60. 43% of Cyber Monday sales are generated from mobile devices, highlighting the significant role that smartphones play in driving online shopping and e-commerce sales.
61. 88% of the top 50 online stores offer special promotions and discounts on Cyber Monday.
62. Cyber Monday has become a major online shopping event, with online buyers collectively spending $12.4 billion annually.
63. During Cyber Week, shoppers in the US can enjoy average discounts of 30% off, while global shoppers can expect an average discount of 27% off.
Mobile Online Shopping Statistics
Mobile online shopping, also known as mobile commerce (m-commerce), refers to the practice of buying and selling goods and services using mobile devices such as phones and tablets.
Due to its convenience and ease of use, mobile shopping has become increasingly popular.
The Rise of Mobile Apps
64. Nearly 78% of online buyers prefer to use a dedicated e-commerce app to make purchases online rather than visiting a mobile-friendly website.
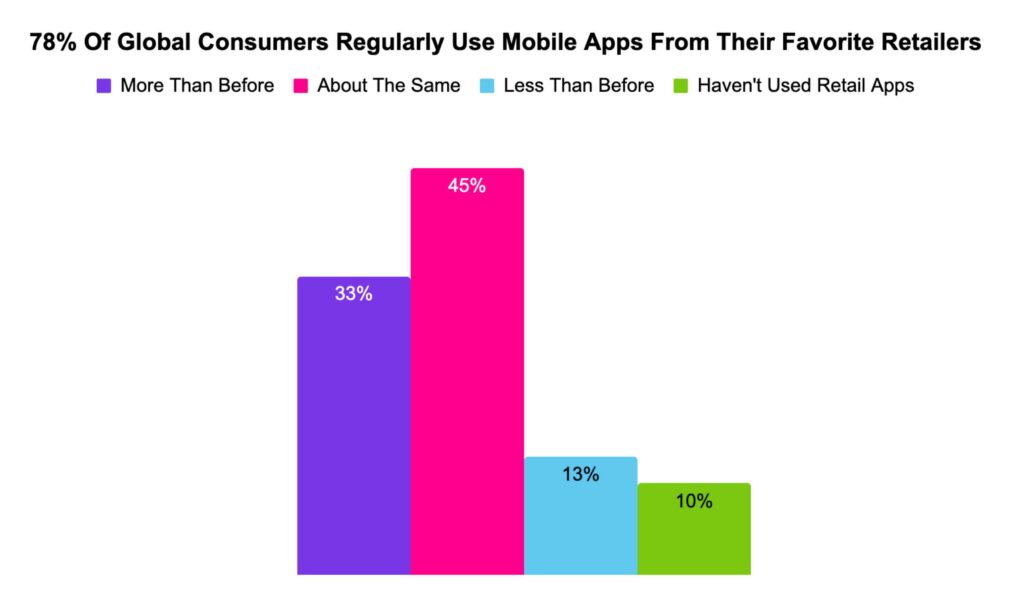
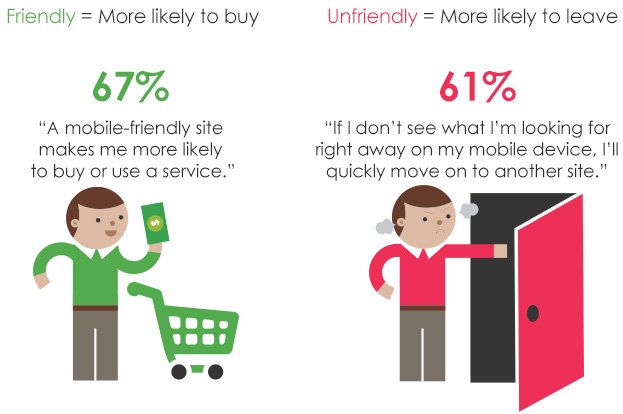
65. 67% of online shoppers are more likely to make a purchase from a mobile-friendly ecommerce website or application.
66. 61% of online buyers will also leave an online store if it isn’t mobile-friendly. This shows the importance of mobile applications.
67. 31% choose in-app shopping over physical stores
The 2022 survey by Newstore reveals a significant shift in consumer preferences, with 31% of respondents opting for in-app shopping over physical store visits.
68. Moreover, 60% of consumers favor mobile shopping apps over mobile websites, with user experience being the primary reason for their preference.
69. 88% of online shoppers agree that they have at least one shopping app on their phone, which is worth noting.
Influencer’s Marketing Impact
70. 89% of marketers believe that influencer marketing delivers an ROI that is equal to or surpasses that of other marketing channels.
71. 78% of marketers consider influencer marketing a successful tactic for boosting brand recognition and visibility due to influencers’ reach with their audience.
72. Influencer marketing campaigns achieve an average engagement rate of 4.2%, outperforming traditional advertising methods and proving the effectiveness of influencer partnerships.
73. More than 60% of online shoppers rely on influencers and their recommendations when making purchasing decisions.
Check Out: 7 Smart Ways to Make Shoppers Trust Your Online Store
Consumer Behavior in Online Shopping
74. 62% of online shoppers expect free shipping as a standard practice and say that they won’t be making a purchase if it’s not offered.
75. 81% of online shoppers place equal trust in online reviews and personal recommendations from friends and family when making purchasing decisions.
76. 49% of customers visited online retail and made an impulse purchase by buying a product they hadn’t originally intended to buy solely because they received a personalized product recommendation.
77. 89% of consumers credited video content as a key factor in their purchasing decision, stating that watching a video played a crucial role in convincing them to buy a product.
78. Around 67% of online shoppers prefer using live chat assistance over phone, email, or social media when seeking customer service.
Build trust & FOMO
Highlight real-time activities like reviews, sales & sign-ups.
Online Shopping Challenges
Consumers face several challenges when it comes to experience and satisfaction regarding online shopping even though online shopping has many benefits.
Here are some key challenges:
Delivery Issues
Consumers often experience delivery issues such as delays, especially during holidays, which can lead to frustration.
Sometimes, packages can also get lost or damaged during delivery, and all of that can take additional time to resolve.
79. A Convey study reports that 84% of consumers are less likely to return after just one bad experience with delivery.
Product Quality
Sometimes, the product that is received does not match the original product in the image and description.
There can also be size and fit problems since all retailers have different size charts, and there is no try-on option.
80. 75% of consumers who shop online return their products due to poor fitting.
Security concerns
Since online buyers need to share their financial details, they can sometimes have security concerns, fearing that there could be data breaches or fraud.
The risk of purchasing online also comes with the potential to get scammed.
Must Read: E-Commerce Fraud Statistics: $48 Billion Lost Annually
81. 42% of adults shop online only to encounter counterfeit or scam products.
Online Shopping Trends to Watch
Online shopping is evolving daily, with new trends and advancements entering businesses. This can change consumer behavior and market dynamics.
Here are a few trends to look out for:
Personalization and AI
Consumers prefer personalized options. AI can easily help businesses give consumers what they need.
With AI, looking for products quickly and accurately will be easier.
82. 54% of online shoppers say they would prefer an e-commerce shop with AI-powered services.
Need to know more? Just go here: 50+ Ecommerce Personalization Statistics & Trends
Subscription Services
Online buyers have been opting for subscription services since they save a lot of money and provide convenience and personalization.
With better subscription services, customers will be more likely to be inclined towards them.
83. The global subscription e-commerce market is expected to reach $478.2 billion, growing at a CAGR of 68% from 2019 to 2025
AR shopping
AR shopping will become more mainstream and widespread.
It will provide virtual try-ons, enhance visualization, provide recommendations, and revolutionize the way consumers shop by interacting with products.
84. By the end of 2025, approximately 1.7 billion people worldwide are expected to use AR at least once.
Sustainable shopping
Online buyers prefer sustainable shopping options to reduce the impact on the environment.
There will be extreme progress with sustainability in future trends. Eco-friendly packaging, increased transparency, and zero-waste models will all be a part of this.
85. 80%, which is more than half of the total consumers, are willing to pay more for sustainable products.
Wrap up
Online shopping has become an essential part of our lives, and its impact on the retail industry is undeniable.
With the rise of social media, sustainable shopping, and technological advancements, the future of e-commerce looks promising.
With the increase in digital shopping, we can expect even more innovative and convenient ways, such as AI, AR, etc., to shop, sell, and connect.
The future of retail is online, and embracing it can benefit consumers in various ways.
Sources
