
Coaching KPIs: 6 Metrics Every Online Coach Should Track (2026)
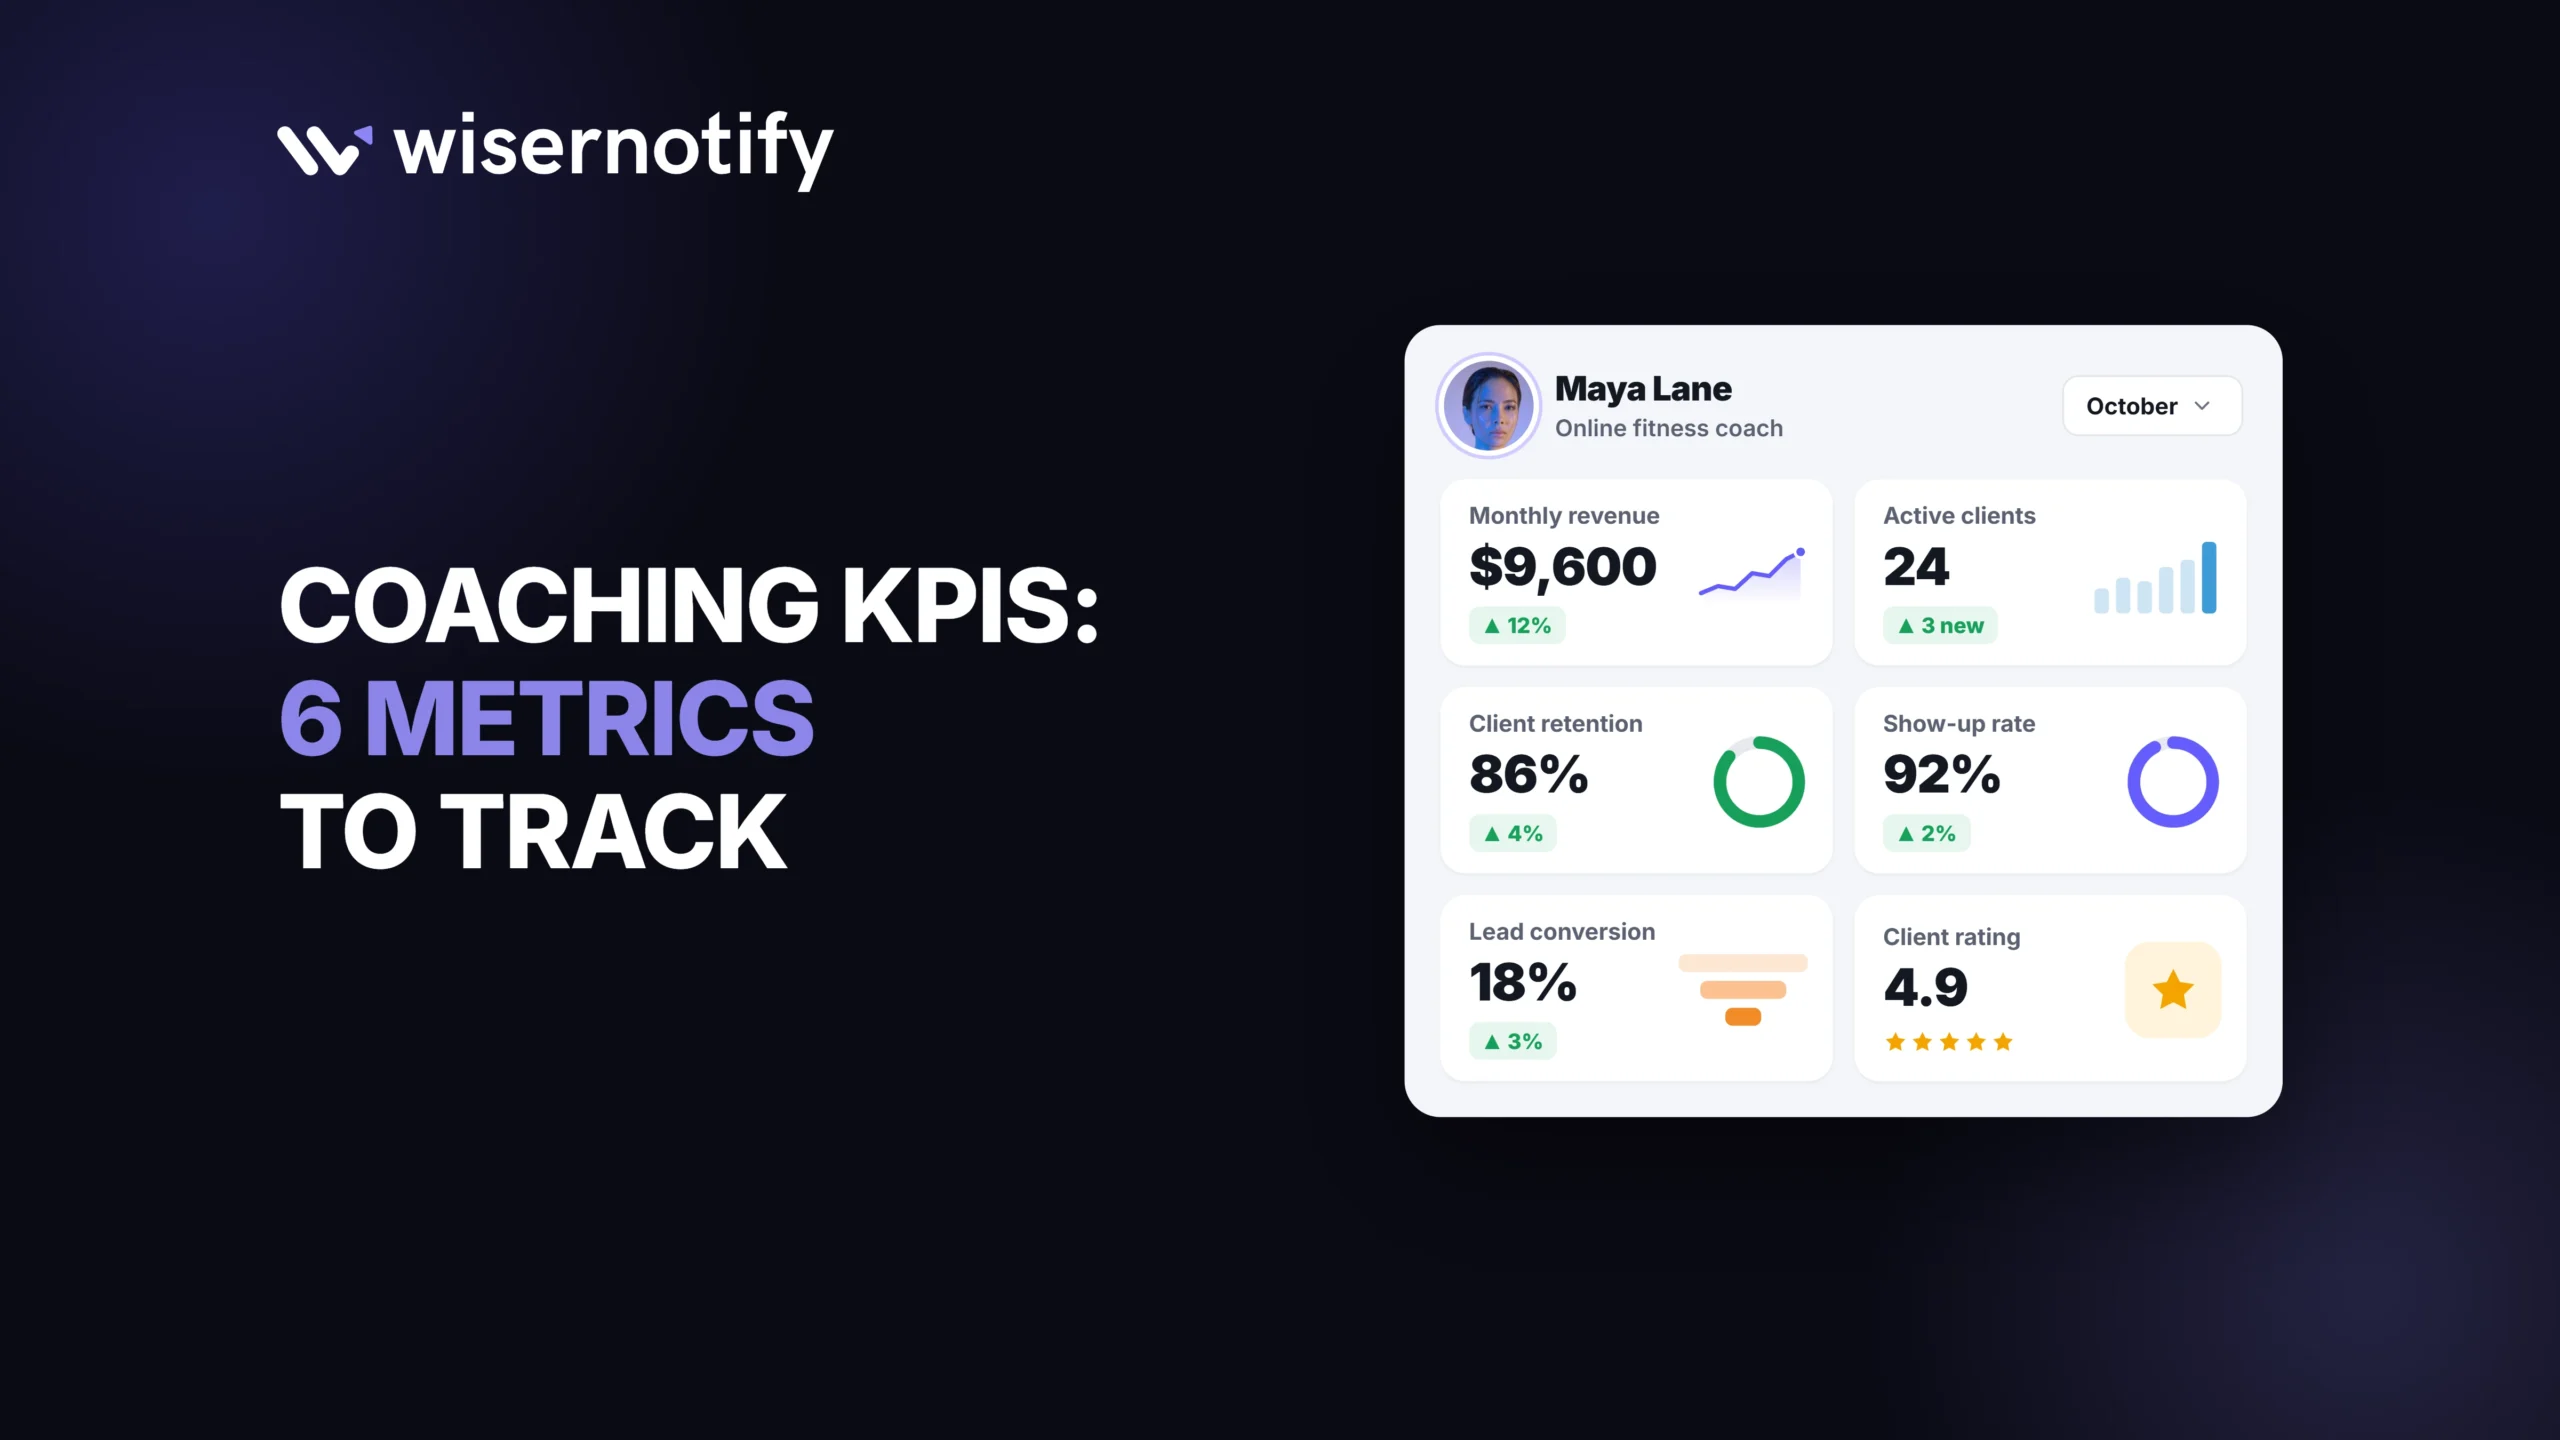
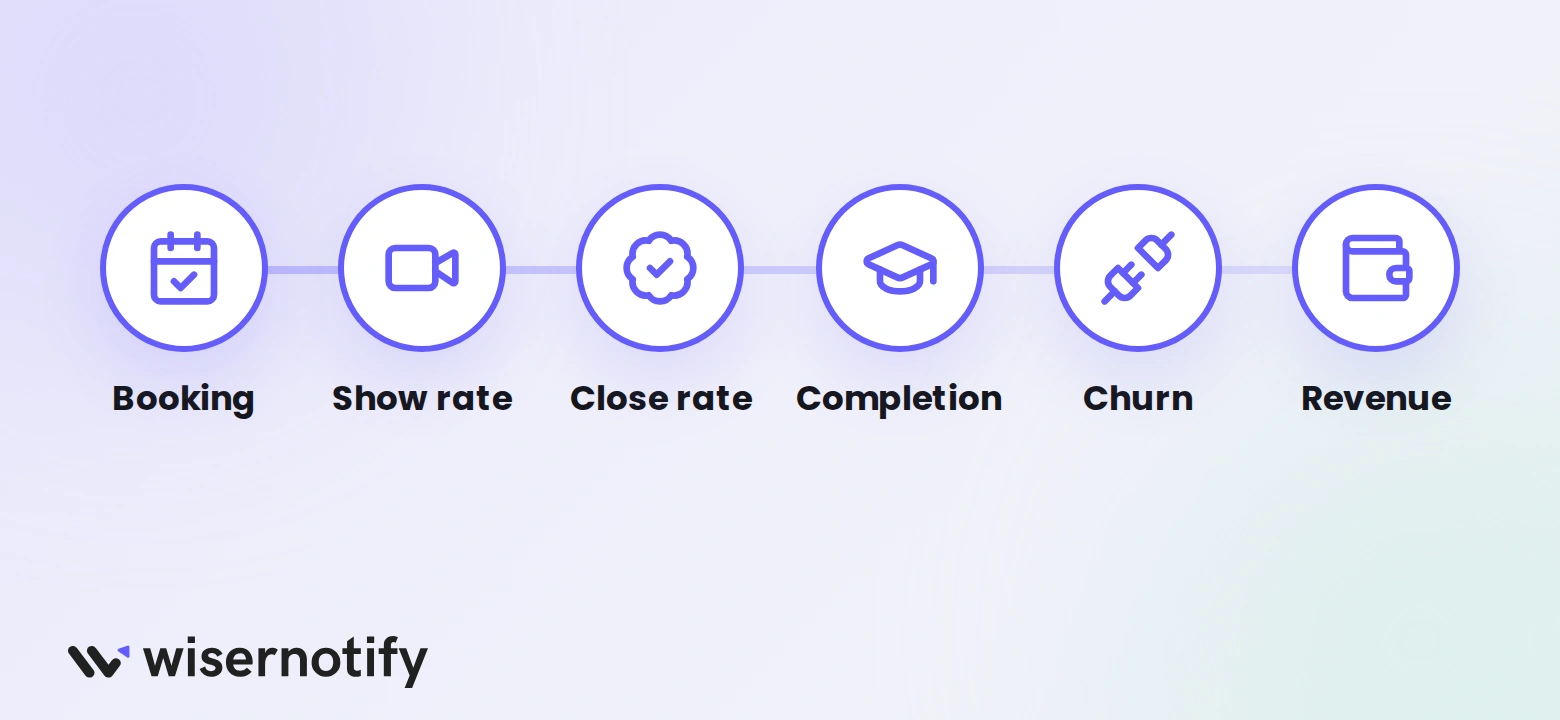
The KPIs an online coach should track are booking page conversion rate, discovery call show rate, close rate and pipeline, program completion rate, churn, and revenue per client. Check the first three every week and the rest every month.
Start with your own three-month baseline, because most coaching metrics have no reliable public benchmark. This guide gives the formula, the check-in rhythm, and the fix for each number.
It is written for coaches who sell coaching. If you want KPI coaching for a team or an employee, it is a different topic.
Key Takeaways
- Track six numbers: booking page conversion, show rate, close rate, completion rate, churn, and revenue per client.
- Review the top of the funnel weekly and client results monthly.
- Your own three-month average is the benchmark that counts.
- Split every rate by traffic source, so you know which channel earns calls.
- Change one thing at a time, then read the same KPI again.
Coaching KPIs at a Glance
| KPI | Formula | Benchmark | How often |
|---|---|---|---|
| Booking page conversion rate | Calls booked ÷ booking page visitors × 100 | Median landing page converts about 6.6% | Weekly |
| Discovery call show rate | Calls held ÷ calls booked × 100 | Set your own baseline | Weekly |
| Close rate and pipeline | New clients ÷ calls held × 100, plus leads at each stage | Set your own baseline | Weekly |
| Program completion rate | Clients who finish ÷ clients who start × 100 | Set your own baseline | Monthly |
| Churn | Clients lost in the month ÷ clients at month start × 100 | Set your own baseline | Monthly |
| Revenue per client | Total revenue ÷ active clients | Set your own baseline | Monthly |
The 6 Coaching KPIs to Track
1. Booking Page Conversion Rate
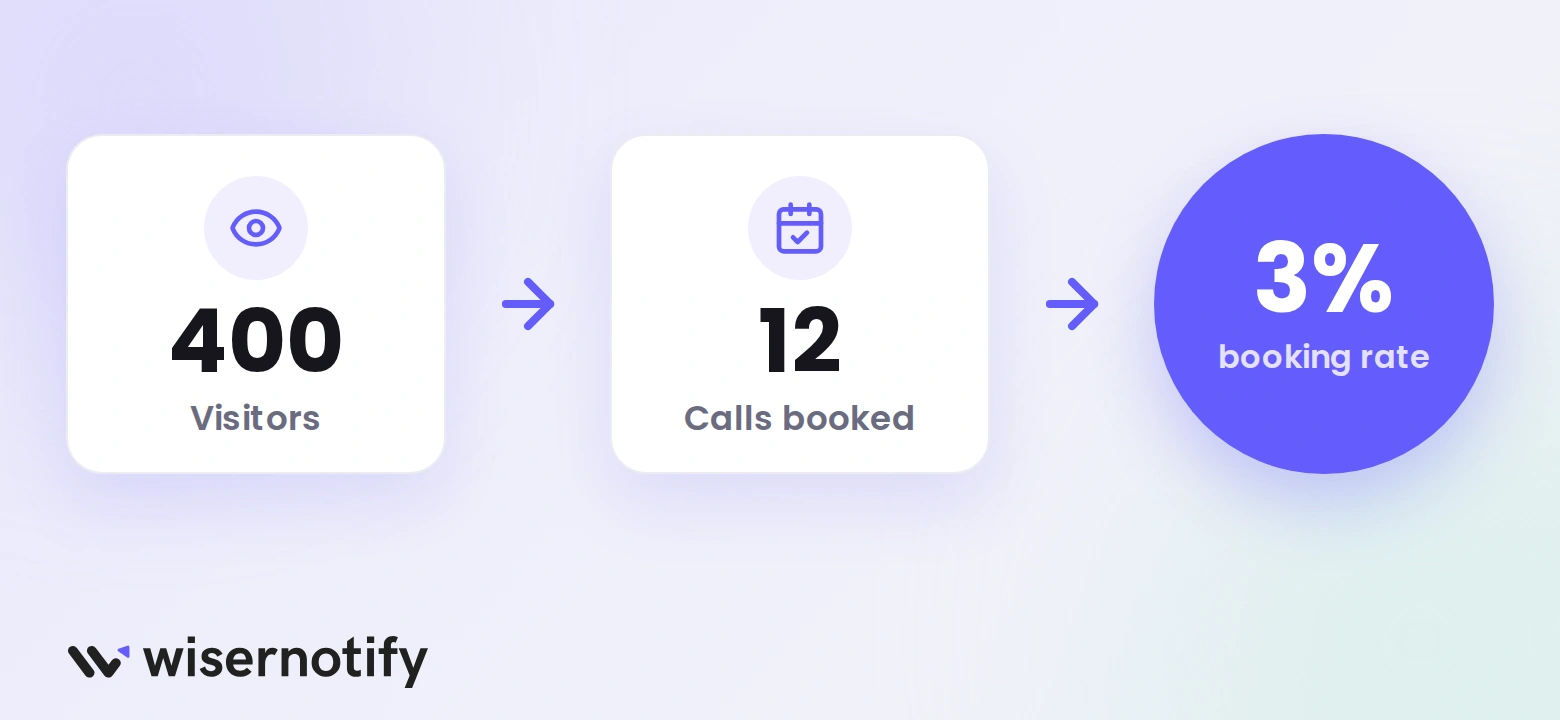
This is the share of booking page visitors who book a discovery call. If 400 people visit and 12 book, your rate is 3%.
Across industries, the median landing page converts about 6.6% of visitors. Treat it as a rough bar, not a target.
Split the rate by source. Visitors from email convert best in that data, so check each channel on its own.
- Cut the form to the fields you need to qualify the call.
- Put proof near the button, such as a client result or a review.
- Match the page headline to the promise in the ad or email.
The conversion rate guide shows the math on any page.
2. Discovery Call Show Rate
Show rate is the share of booked calls that happen. A low rate means you spend calendar time on people who never join.
- Send a reminder the day before and an hour before.
- Ask for a one-word reply to confirm.
- Offer a reschedule link in every reminder.
There is no reliable public benchmark here. Log your last 20 booked calls, count the no-shows, and use that as your baseline.
3. Close Rate and Pipeline
Close rate is new clients divided by calls held. Pipeline is the count of leads sitting at each stage: booked, held, proposal sent, paid.
A healthy pipeline has people at every stage. If calls are strong but few turn into clients, the problem is qualification or the offer, not traffic.
- Add a short form question on budget or timing before the call.
- Follow up within a day, then once more a few days later.
- Write down why each lost lead said no, and look for a pattern each month.
4. Program Completion Rate
Completion rate is the share of clients who finish the program they started. It is the best early sign that your coaching works.
Watch session attendance as the leading signal. A client who skips two sessions in a row is worth a check-in.
- Check in after the second session, while habits are still forming.
- Set one clear action step per session.
- Ask the clients who left what got in the way.
5. Churn
Churn is the share of clients you lose in a month. Retention is 100 minus churn. For fixed-length programs, track renewals and re-enrollments instead.
Churn shows whether clients got what you promised. It also drives revenue, because every client you keep is revenue you do not have to win again.
6. Revenue per Client
Revenue per client is total revenue divided by active clients. Track lifetime revenue per client as well, once you have a year of data.
Compare it to what it costs you to win a client. If you earn less per client than you spend to find one, fix pricing or packaging before you spend more on ads.
Build trust & FOMO
Highlight real-time activities like reviews, sales & sign-ups.

How to Track Your KPIs Without a Dashboard
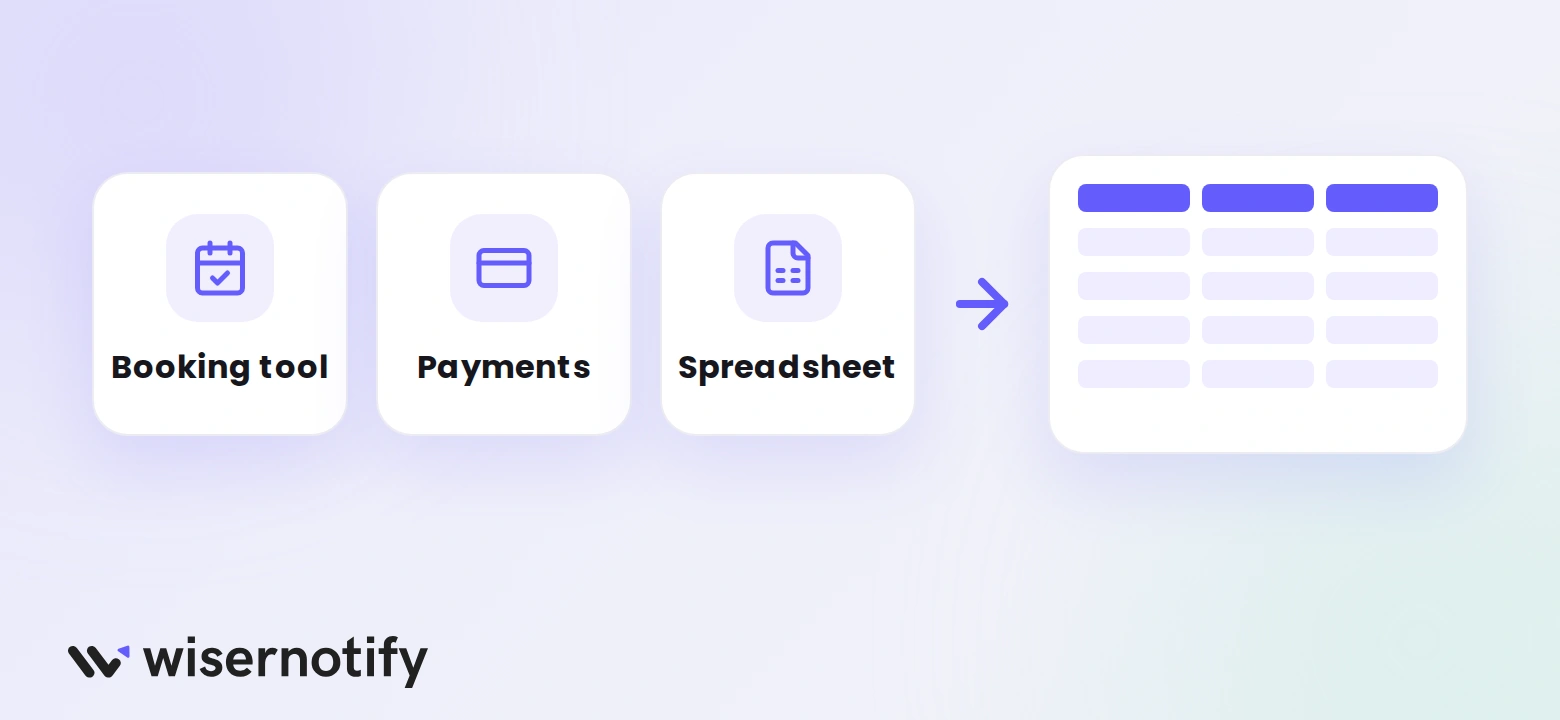
- Pick one home for each number: your booking tool for calls, your payment tool for revenue, and a spreadsheet for the rest.
- Mark your booking confirmation page as a key event in Google Analytics 4, so booking page conversion tracks itself.
- Add one row per week with the six numbers, and a note on what you changed.
- Review the sheet monthly against your three-month average.
Once the sheet runs, automate the busywork in your coaching business so tracking takes minutes, not hours.
How to Raise Your Booking Page Conversion Rate

Booking page conversion is the first number in the funnel, so it lifts every number after it. Visitors hesitate when they see no sign that other people booked.
WiserNotify adds social proof notifications for online coaches to your booking page, such as recent bookings and reviews, without code. Track the rate for a few weeks before and after, then compare.
For more fixes, read how to increase landing page conversion rates and what a good landing page conversion rate looks like.
Common KPI Mistakes
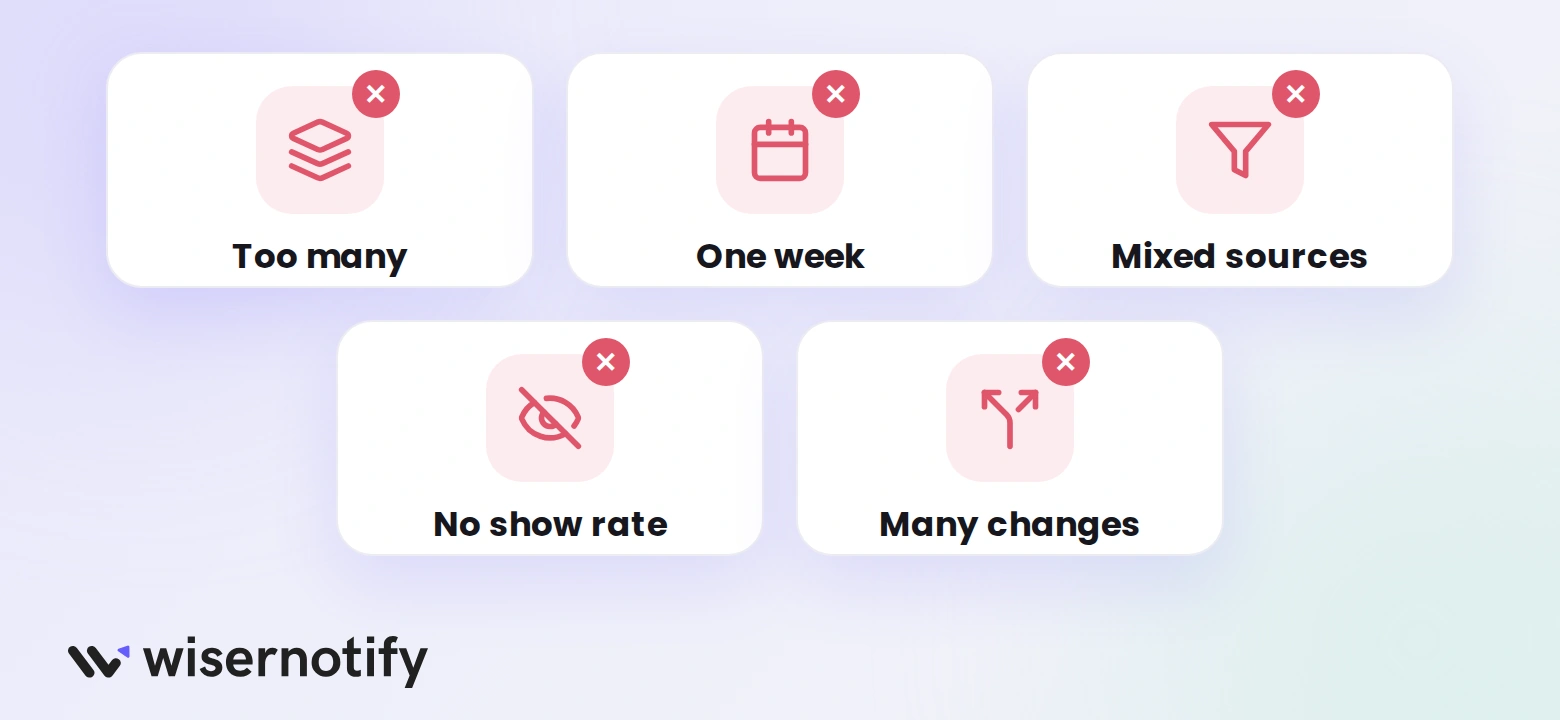
- Tracking too many numbers: six is enough, and more hides the signal.
- Reading one week alone: small samples swing, so compare against a three-month average.
- Mixing sources: a blended rate hides which channel works.
- Skipping show rate: a booking page can look great while booked calls never happen.
- Changing several things at once: you cannot tell which change moved the number.
Wrap Up
Six numbers tell you how your coaching business is doing: how many visitors book, show up, buy, finish, stay, and what each client is worth.
Start with the first three each week, set your own baseline, and change one thing at a time. The trend matters more than any single reading.
Related Reads:
Frequently Asked Questions
What KPIs should an online coach track?
Track booking page conversion, discovery call show rate, close rate, program completion rate, churn, and revenue per client.
What is a good discovery call show rate for coaches?
There is no reliable public benchmark. Count the no-shows in your last 20 booked calls, and use that as your baseline.
How often should I review coaching KPIs?
Review booking, show rate, and close rate weekly. Review completion, churn, and revenue per client monthly.
What is the difference between coaching KPIs and KPI coaching?
Coaching KPIs measure a coaching business. KPI coaching usually means coaching a team against its targets, and this guide covers the first.

Krunal Vaghasiya is a marketing tech expert who boosts e-commerce conversion rates with automated social proof and FOMO strategies. He loves to keep posting insightful posts on online marketing software, marketing automations, and improving conversion rates.




 Capterra