
48 Popup Statistics for 2026 (Conversion Rates by Trigger)
The average popup converts somewhere between 0.83% and 11.09% of the people who see it. The spread is that wide because the four big studies count different things.
So the first job of any popup benchmark is to say what it divides by.
Line the studies up and the same patterns appear in all of them. Mobile beats desktop, a real offer beats a bare signup box, and a popup that fires after a click beats one that fires on page load.
Here are 48 popup statistics for 2026, drawn from four datasets covering more than 2.7 billion popup displays.
Key takeaways
- Omnisend puts the average email popup at 2.1% of displays, Wisepops at 4.82%, OptiMonk at 11.09%, and Popupsmart’s median lead-collecting popup at 0.83%.
- Click-triggered popups convert at 54.42%, more than ten times the 3.94% of exit-intent popups.
- Mobile popups beat desktop in every dataset, and 63% of popup displays now happen on phones.
- Spin-to-win, discounts and countdown timers all lift conversion in Wisepops’ data, but Omnisend found countdown timers made things slightly worse.
Key Popup Statistics
| Statistic | Figure |
|---|---|
| Average popup conversion rate | 0.83% to 11.09%, depending on the study |
| Omnisend average, 1.24 billion displays | 2.1% |
| Wisepops average, 1 billion displays | 4.82% |
| Top 10% of Wisepops campaigns | 57.7% |
| Click-triggered popups | 54.42% |
| Exit-intent popups | 3.94% |
| Cart abandonment popups (OptiMonk) | 17.12% |
| Spin-to-win vs standard popups (Wisepops) | 29.99% vs 4.04% |
| Mobile vs desktop (Wisepops) | 4.98% vs 3.67% |
| Share of popup displays on mobile (Popupsmart) | 63% |
What Is the Average Popup Conversion Rate?
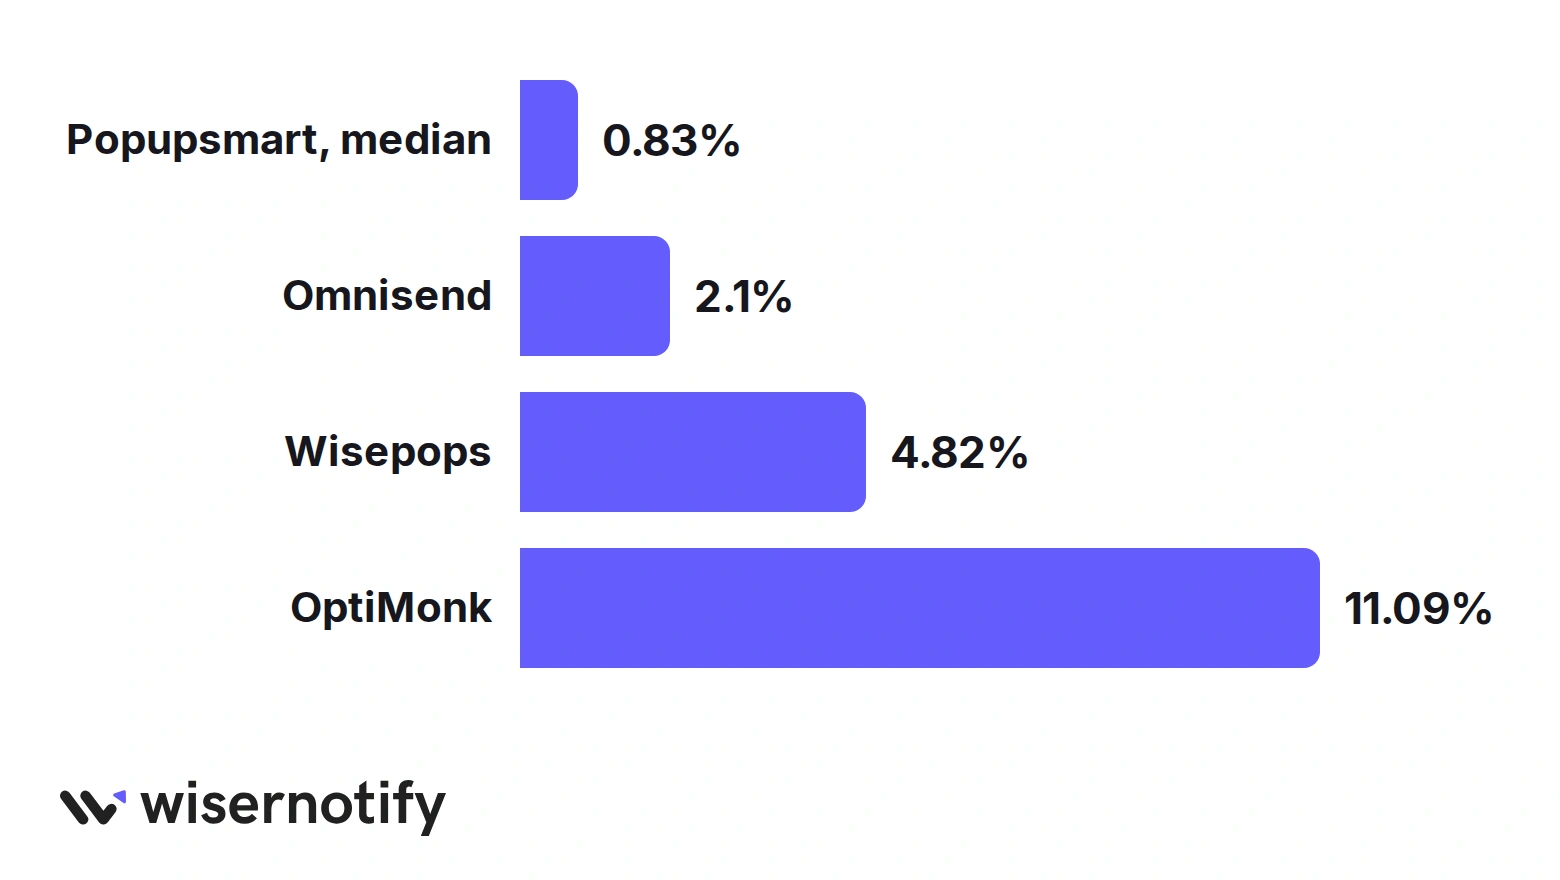
There is no single average. Each study below divides a different numerator by a different denominator, which is why the numbers sit so far apart.
- Omnisend measured 2.1% across 1.24 billion email popup displays in 2025, down from 2.3% the year before.
- Wisepops measured 4.82% across 1 billion displays of email signup popups, up from 4.65%.
- OptiMonk reports 11.09% across its users’ popups, a figure that includes high-converting types like cart abandonment popups.
- Popupsmart’s 2026 benchmark, which counts only submissions with an email or phone number, puts the median popup at 0.83% of displays.
- Popup use is still growing fast. Omnisend’s displays rose 54% in a year, and emails collected rose 44%.
- Omnisend’s working scale is below 1.5% underperforming, 1.5% to 3% average, 3% to 5% good, and 5% and up excellent.
If you compare your own popup to one of these numbers, use the one that counts the way your tool does. A click on a spin wheel is not a lead.
What the Top Popups Look Like
The gap between an average popup and a great one is bigger than the gap between any two studies.
- The top 10% of Wisepops campaigns convert 57.7% of the people who see them, twelve times the average.
- OptiMonk’s top 10% average 42.35%.
- In Popupsmart’s data, the top quarter of lead popups convert 1.96% or more of displays and the top 10% reach 3.87%.
- Popups that run A/B tests lift click-through by up to 26% in Wisepops’ data, from 4.64% to 5.86%.
Popup Conversion Rates by Industry
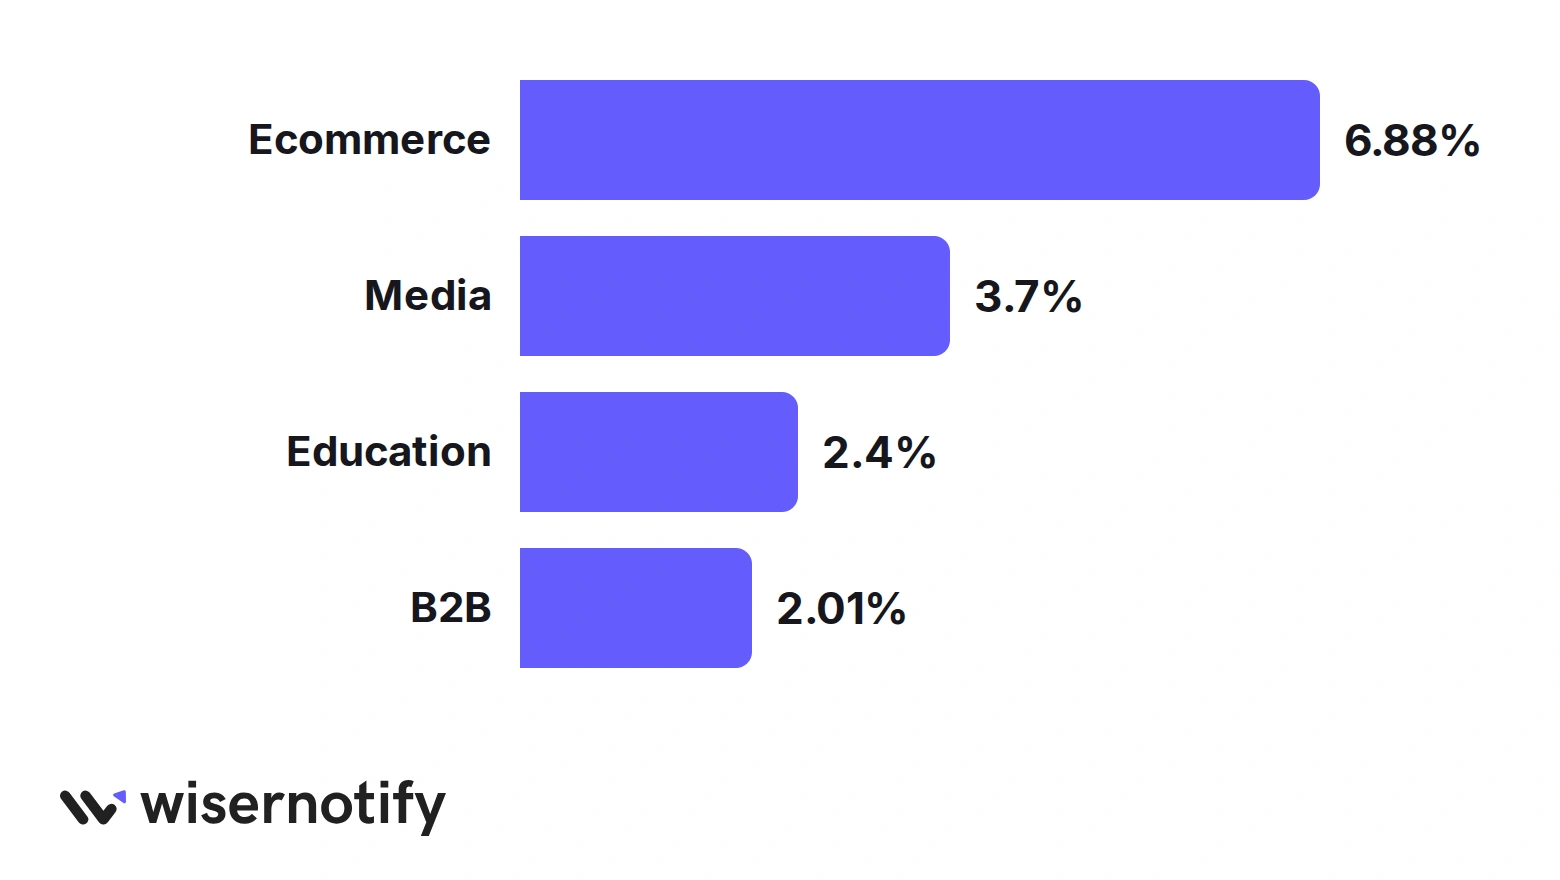
Ecommerce leads in every dataset, which makes sense. A discount is worth more to someone about to buy than to someone reading an article.
- Ecommerce popups convert at 6.88% in Wisepops’ data, with media at 3.70%, education at 2.40% and B2B last at 2.01%.
- Popups on Shopify stores convert at 6.97% against 4.73% on other platforms.
- In Popupsmart’s medians, finance and insurance popups lead at 2.22% and software popups trail at 0.39%.
- The page matters as much as the industry. Popupsmart’s median cart or checkout popup converts 4.57%, the home page 1.07% and a blog post 0.23%.
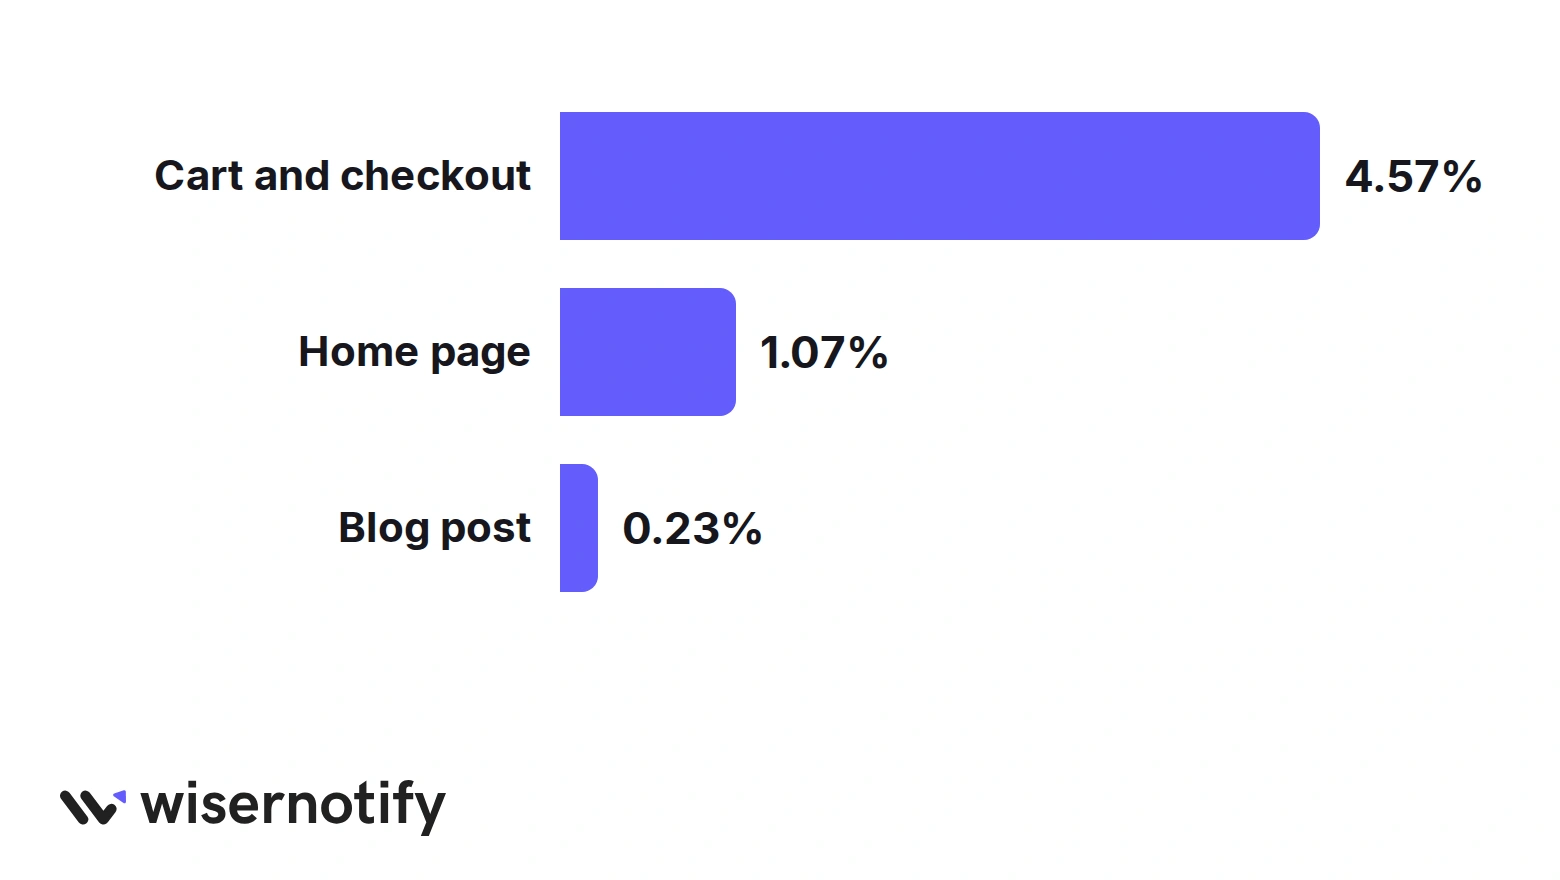
A 1% rate on a blog popup is strong. The same 1% on a cart page is well below the middle. These cart abandonment statistics show why cart pages carry so much intent.
Build trust & FOMO
Highlight real-time activities like reviews, sales & sign-ups.


Mobile vs Desktop Popup Statistics
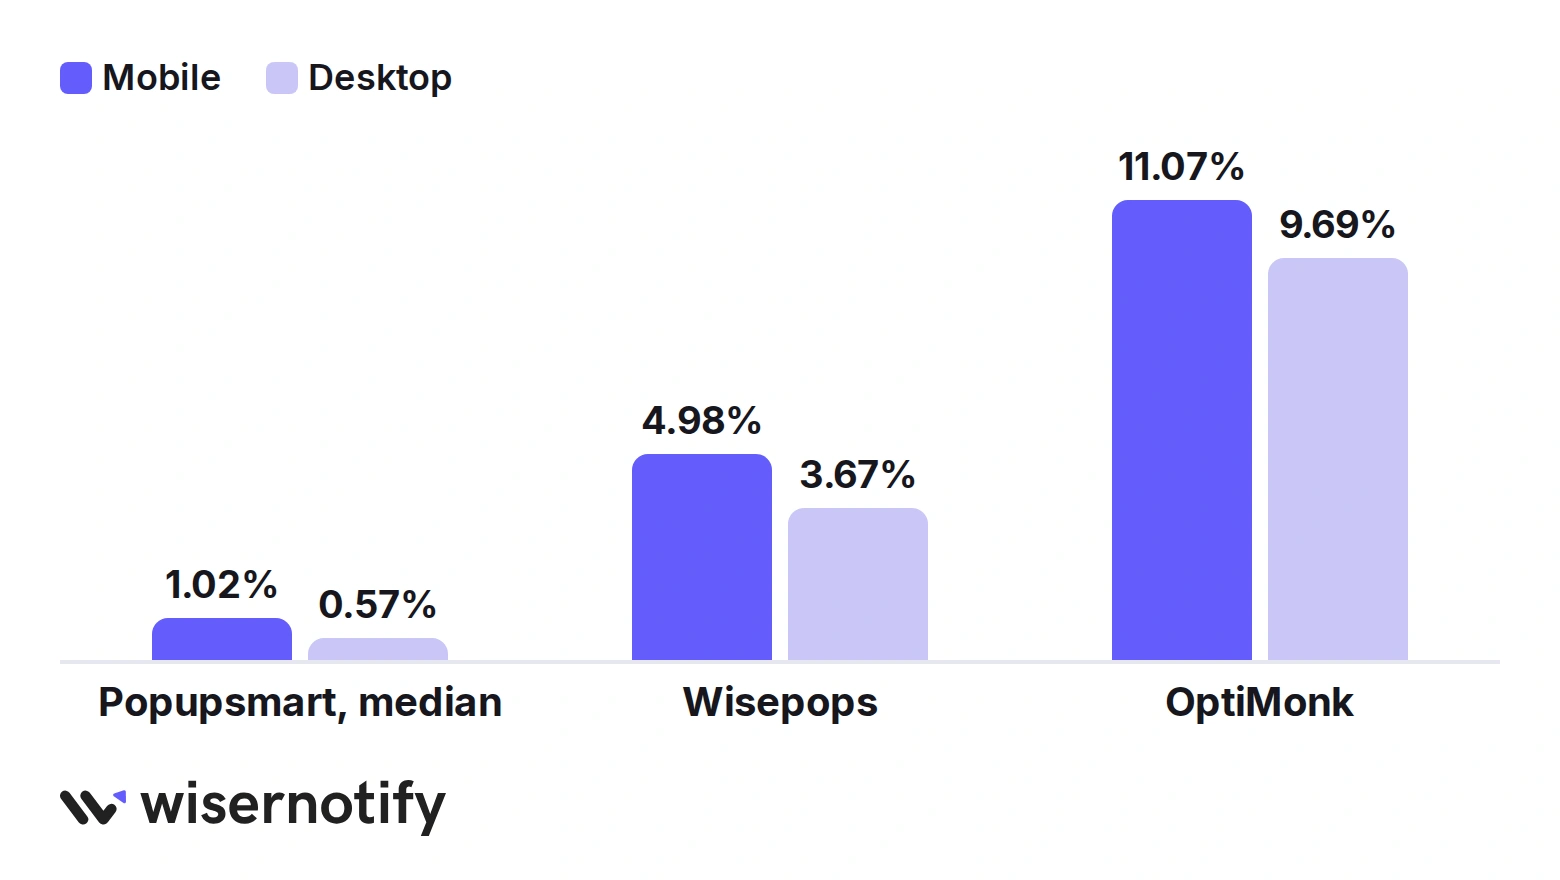
Three studies, three different scales, and mobile wins in all of them.
- Mobile popups convert at 4.98% against 3.67% on desktop in Wisepops’ data, a 36% difference.
- OptiMonk sees 11.07% on mobile and 9.69% on desktop.
- Popupsmart’s median mobile popup converts 1.02% of displays, almost double the 0.57% on desktop.
- 63% of popup displays now happen on mobile.
- Omnisend found desktop-only popups converting at 1.4%, while popups shown on both devices reached 2.2%.
Mobile popups work because they fill the screen and force a decision. That cuts both ways, so keep the close button obvious.
Which Popup Trigger Converts Best?
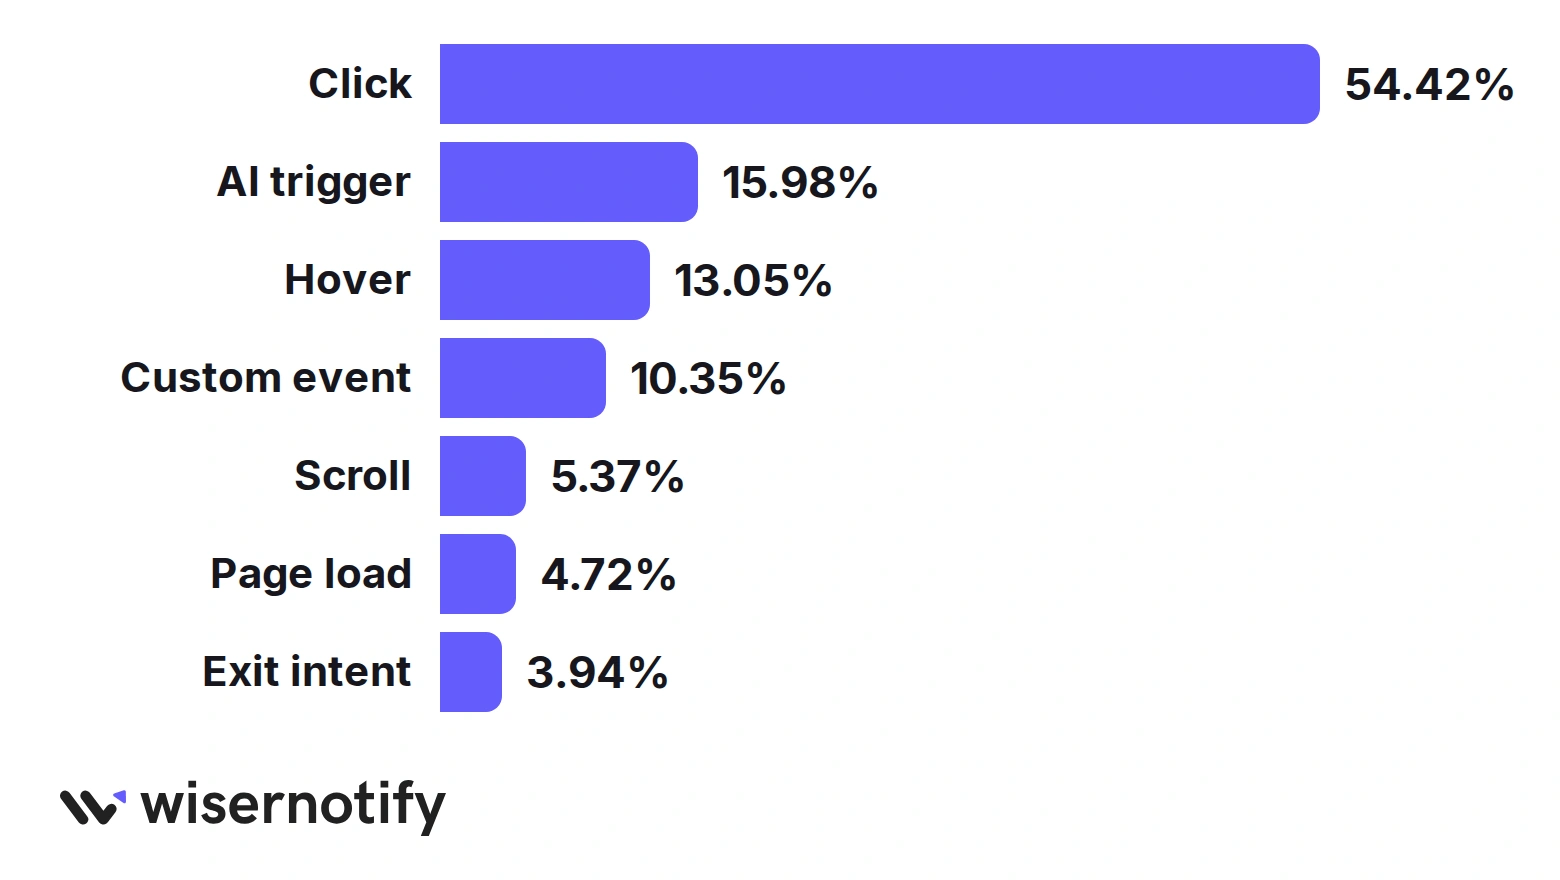
The trigger decides who sees the popup and in what mood. Nothing else in the data moves the number this much.
- Click-triggered popups convert at 54.42%, because the visitor asked to see them.
- AI-timed triggers, which pick the moment from visitor behavior, convert at 15.98%.
- Hover triggers reach 13.05% and custom-event triggers 10.35%.
- Scroll triggers convert at 5.37%, page-load popups at 4.72%.
- Exit-intent popups sit at 3.94%, the lowest trigger in Wisepops’ data. Omnisend saw the same pattern at 1.8%.
- Popupsmart’s most sensitive exit-intent setting converted 1.10% against 0.78% without exit intent, a gap small enough to be chance.
Exit intent still earns its place on cart pages, where the goal is saving an order rather than collecting an email. These exit intent popup examples show the difference.
Popup Timing Statistics
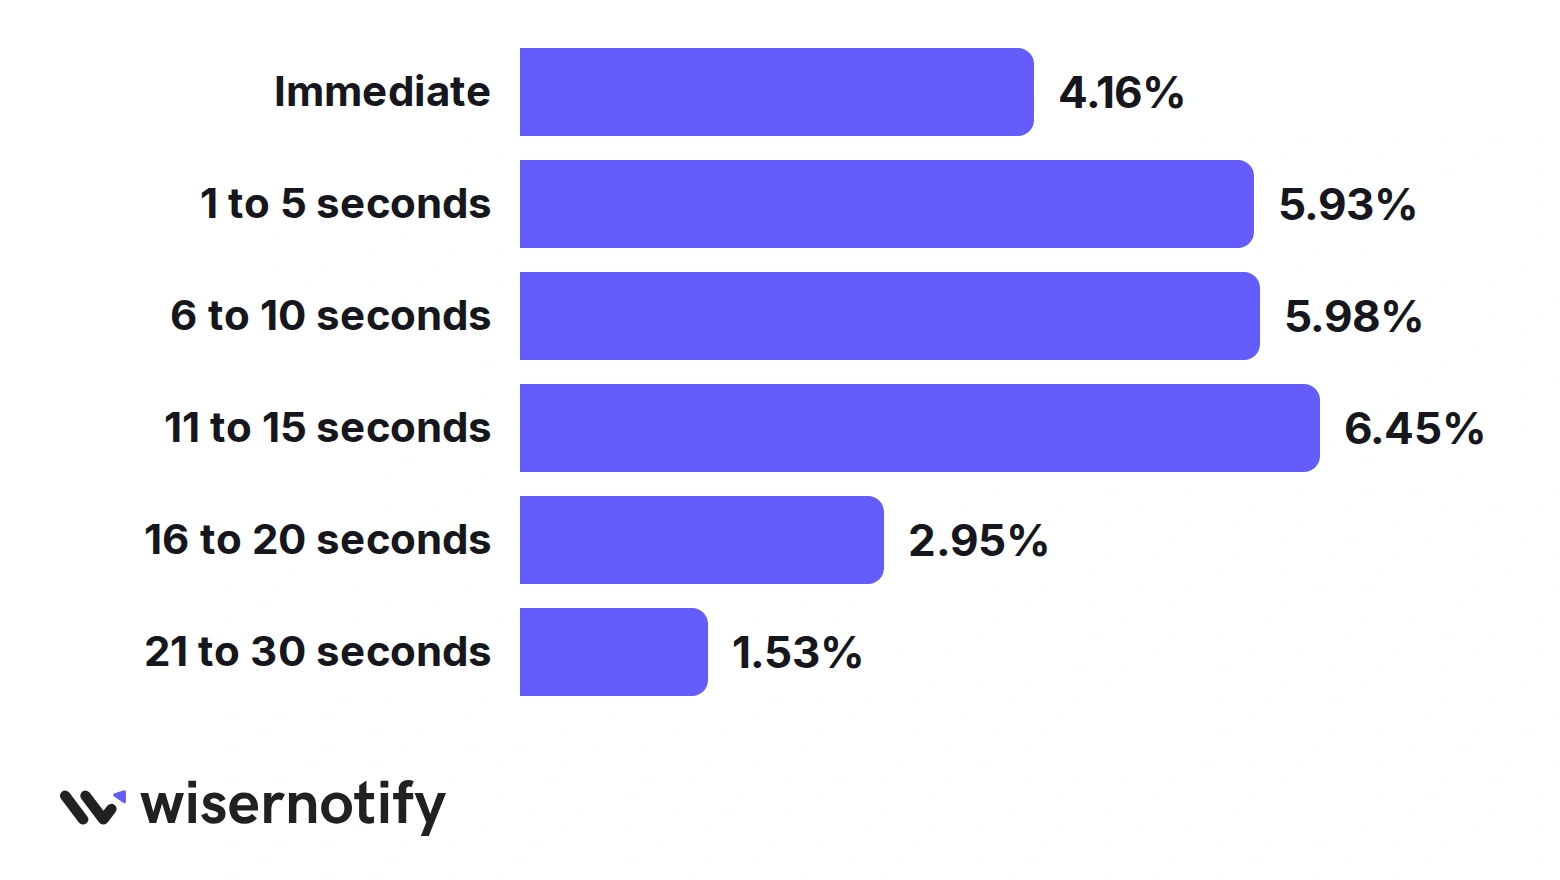
Both billion-display studies agree on the shape here. Wait a few seconds, but not too many.
- Popups shown after 11 to 15 seconds convert best in Wisepops’ data at 6.45%, with 6 to 10 seconds close behind at 5.98%.
- Immediate popups convert at 4.16%, and anything past 20 seconds falls to 1.53%.
- Omnisend’s sweet spot is 6 to 10 seconds at 2.4%, against 1.9% for popups that fire the moment the page loads.
- Popups shown after a visitor’s second page view convert at 9.84%, against 7.87% after one page and 4.74% after three.
- Visitors decide fast. 71% of people who close a popup do it within 5 seconds, and 61% of leads arrive within 30 seconds of the popup appearing.
Which Popup Types Convert Best?
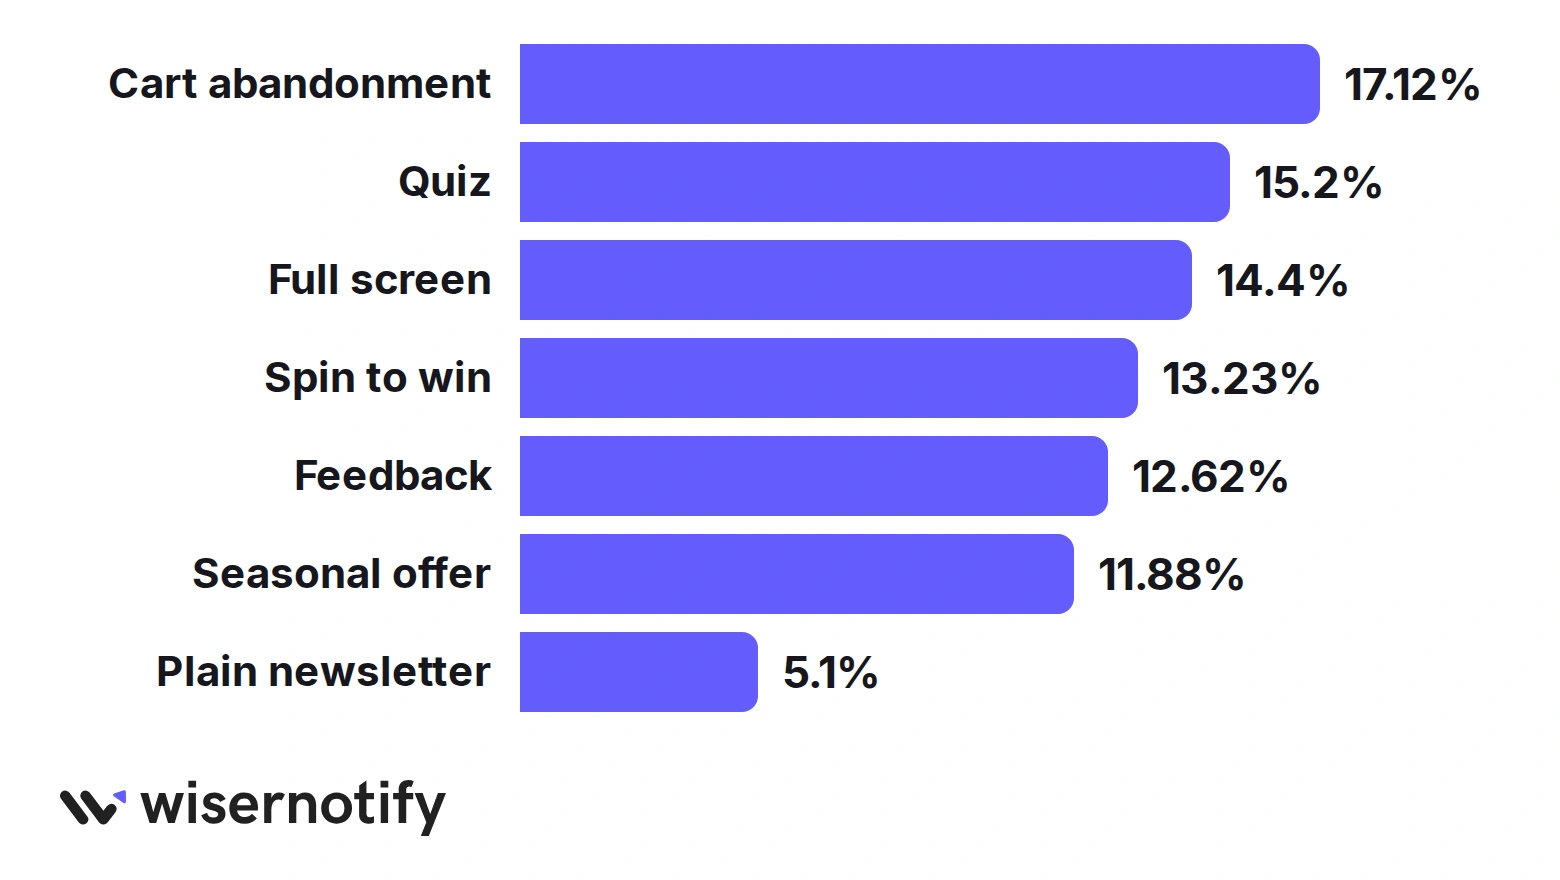
OptiMonk breaks its data down by what the popup is for. The ranking says more about visitor intent than about design.
- Cart abandonment popups convert at 17.12%, the highest of any type.
- Quiz popups, which ask a question before the email, reach 15.2%.
- Full-screen popups convert at 14.40% and feedback popups at 12.62%.
- Seasonal offer popups convert at 11.88%, which is why holiday campaigns lean on them so hard.
- A plain newsletter popup with no incentive converts at 5.10%. Adding an ebook lifts it to 7.49% and a discount to 7.65%.
Seasonal popups pair well with a deadline. These limited-time offer ideas show how brands word them.
Build trust & FOMO
Highlight real-time activities like reviews, sales & sign-ups.
Offers, Timers and Images
This is where the studies disagree most, so each number carries its source.
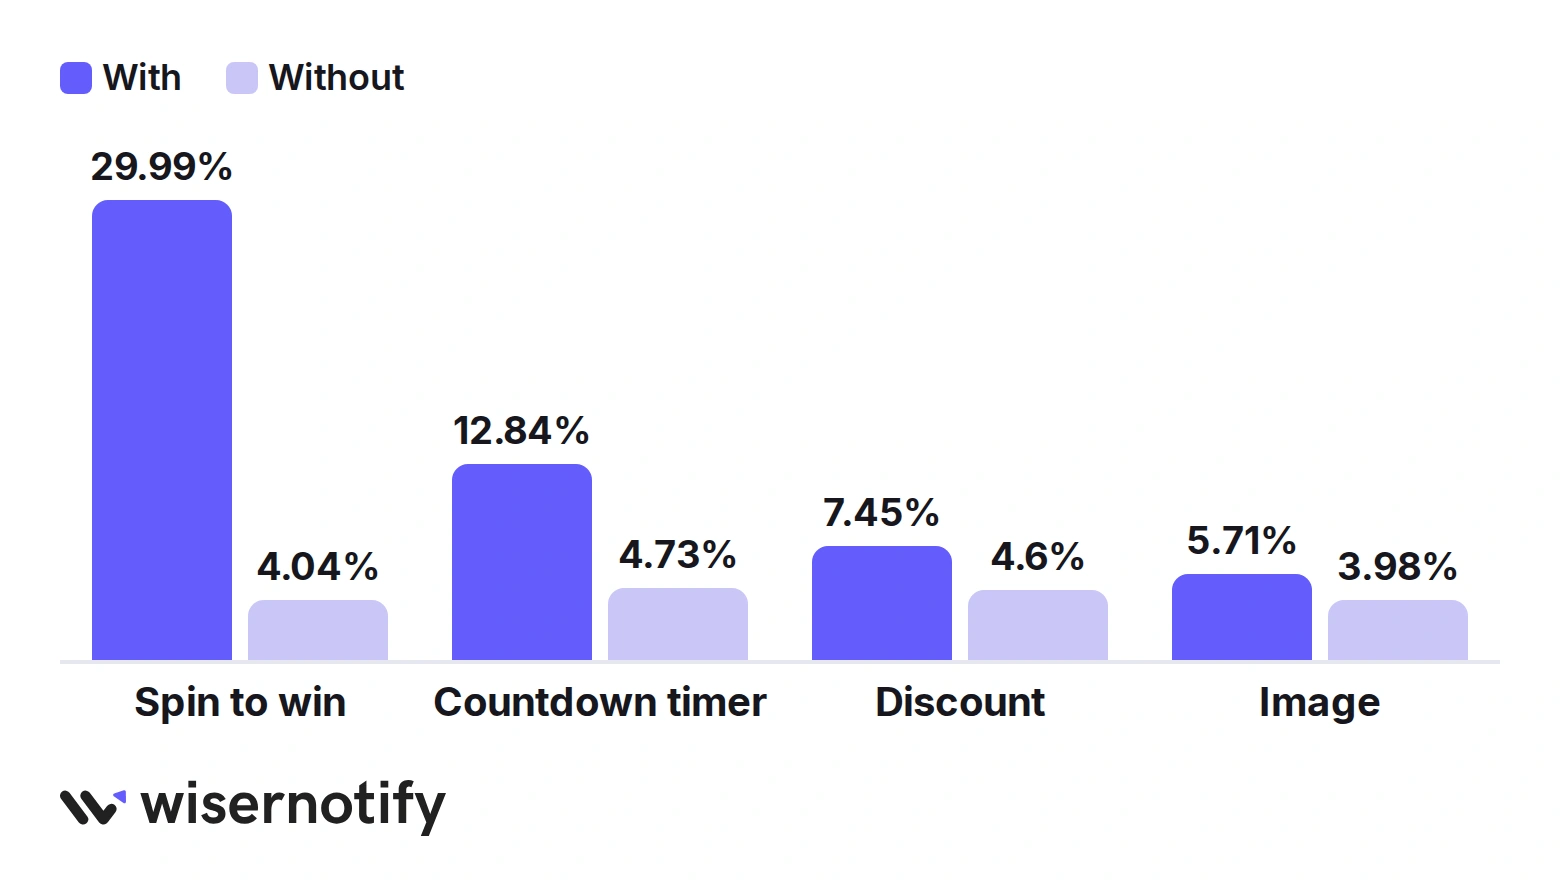
- Spin-to-win popups convert at 29.99% against 4.04% for standard popups in Wisepops’ data. Omnisend saw a smaller but clear lift, 3.5% against 2.0%.
- Popups with a discount convert at 7.45% against 4.60% without in Wisepops’ data. Omnisend found a 41% lift, 2.4% against 1.7%.
- Countdown timers lift conversion to 12.84% from 4.73% in Wisepops’ data and to 14.41% from 9.86% in OptiMonk’s. Omnisend found the opposite, 1.9% with a timer against 2.1% without.
- Images lift conversion to 5.71% from 3.98% in Wisepops’ data. OptiMonk and Omnisend both found almost no difference.
- Three form fields convert best in Wisepops’ data at 7.86%, while Omnisend sees the drop start at four fields and Popupsmart at three.
- Gamified popups get 7.33% of displays to click against 1.87% for plain popups in Popupsmart’s data, but no more email leads. The spin counts as a click.
- First-person button copy such as “Send my code” converts 1.18% against 0.80% for neutral wording.
The safe reading is that a real offer helps everywhere, and urgency helps when the deadline is real. A countdown timer on a fake deadline is the version Omnisend’s data punishes.
Where to Place a Popup
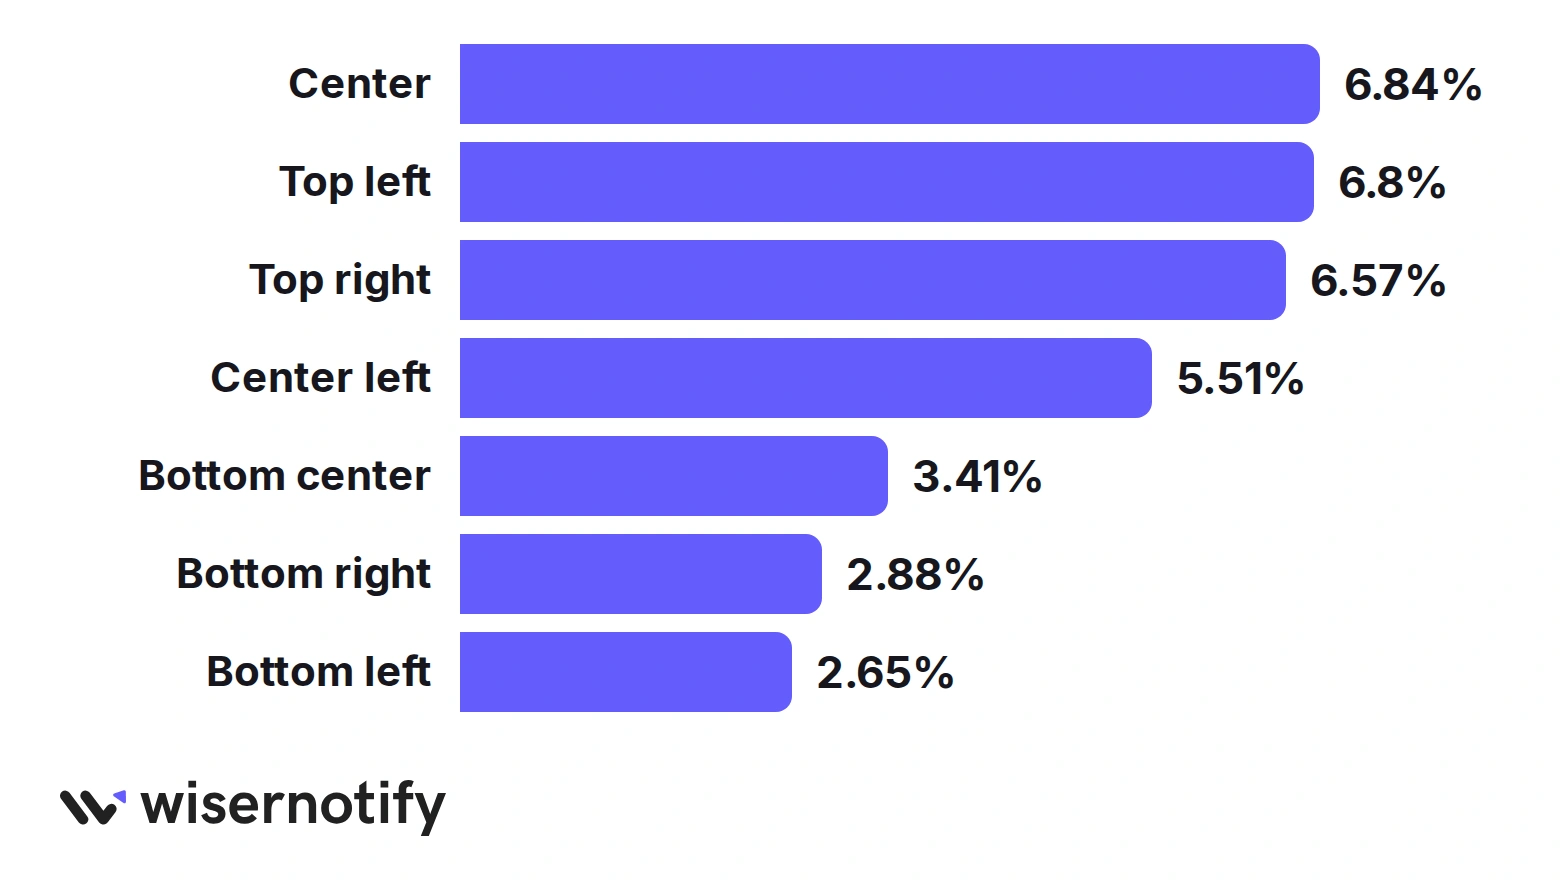
Position is a smaller lever than trigger or offer, but the bottom corners lose on both big datasets.
- Center popups convert at 6.84% in Wisepops’ data, with top-left at 6.80% and top-right at 6.57%.
- Bottom corners trail at 2.65% for bottom-left and 2.88% for bottom-right.
- Omnisend’s best named position is top-left at 2.1%, and its worst is top-right at 1.3%.
Popup Targeting Statistics
Showing the right popup to the right visitor beats showing one popup to everyone.
- Popups aimed at new visitors convert at 8.30%, against 5.09% for returning visitors and 4.60% for untargeted popups.
- URL-targeted popups convert at 5.53%, 130% higher than the 2.40% for popups shown on every page.
- Popups that use UTM targeting convert at 5.84% against 4.51% without, and Popupsmart’s popups with three targeting rules convert at 1.09% against 0.71% with none.

Boost Conversion Instantly
Add Social Proof & Urgency to your website
What These Numbers Mean for Your Site
- Pick your benchmark by page, not by industry. A cart popup and a blog popup have different ceilings.
- Let visitors trigger popups where you can. A “get my code” button converts ten times better than an interruption.
- Wait a few seconds or one page view. Immediate popups lose in every dataset.
- Give something. A discount, a quiz result or a guide beats “subscribe to our newsletter”.
- Count leads, not clicks. A spin wheel inflates click rates without filling your list.
- Show proof without a second interruption. A small WiserNotify notification of recent orders or reviews runs alongside a popup without asking the visitor for anything.
For a comparison of the tools behind these datasets, see this roundup of popup software.
Wrap Up
Popups still convert, and the best ones convert far better than the average suggests. The gap comes down to trigger, timing and offer, not the box itself.
Measure your own rate the way your tool counts it, then work on one lever at a time.
Sources
Wisepops Popup Statistics 2026 | Omnisend Email Popup Performance 2025 | OptiMonk Popup Statistics | Popupsmart 2026 Benchmark
Frequently Asked Questions
What is the average popup conversion rate?
It depends on the study. Omnisend reports 2.1% of displays, Wisepops 4.82%, and OptiMonk 11.09%, because each counts conversions differently.
What is a good popup conversion rate?
Omnisend’s scale calls 3% to 5% good and 5% or more excellent for an email popup.
Which popup trigger converts best?
Click-triggered popups convert at 54.42% in Wisepops’ data, since the visitor chose to open them.
Do exit-intent popups still work?
They convert at 3.94% on average, the lowest trigger, but they still save orders on cart pages.
How long should I delay a popup?
Wisepops’ data peaks at 11 to 15 seconds and Omnisend’s at 6 to 10 seconds, and both find immediate popups convert worse.
Do popups convert better on mobile or desktop?
Mobile wins in every dataset. Wisepops sees 4.98% on mobile against 3.67% on desktop.

Krunal Vaghasiya is a marketing tech expert who boosts e-commerce conversion rates with automated social proof and FOMO strategies. He loves to keep posting insightful posts on online marketing software, marketing automations, and improving conversion rates.




 Capterra