

Did you know that in 2025, the e-commerce industry is projected to hit $6.6 Trillion dollars.
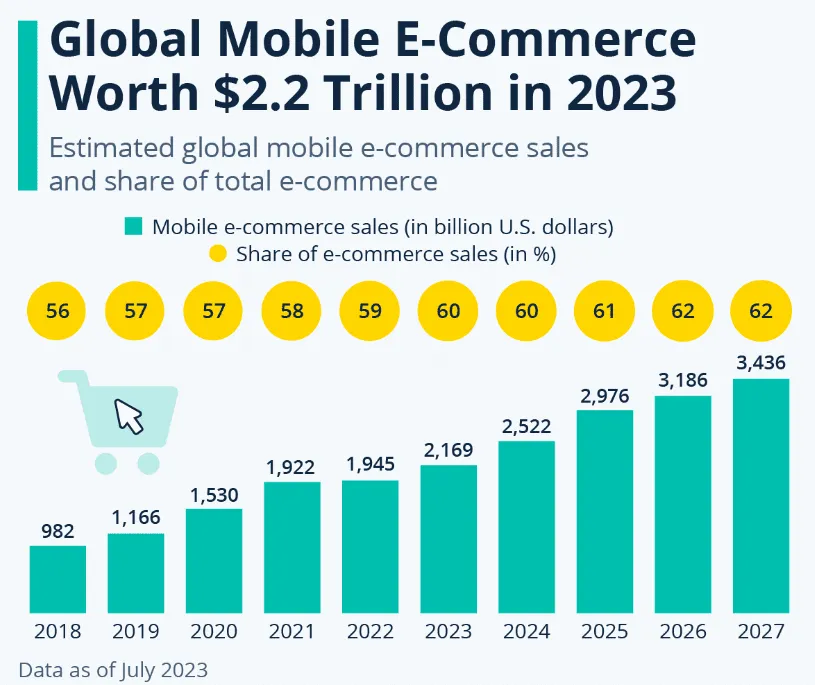
The mobile phone e-commerce industry is a big part of it, valued at a grand total of 2.2 Trillion dollars.
This massive rise has a few simple reasons. Today, you can access the entire world at the tip of your fingers.
Thus, the rise of mobile commerce applications or stores was inevitable.
This shift to mobile devices for shopping is evident by the fact that more than 56% of global consumers prefer their mobile devices for shopping.
Read on till the end to get a better understanding of the current state of mobile commerce with the help of some key mobile commerce statistics.
Build trust & FOMO
Highlight real-time activities like reviews, sales & sign-ups.


Top M-commerce Statistics
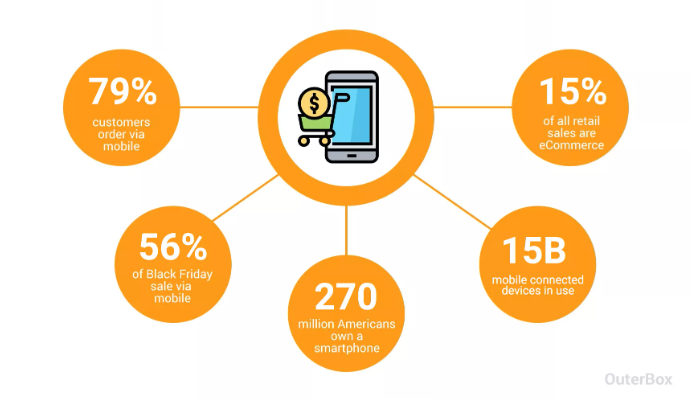
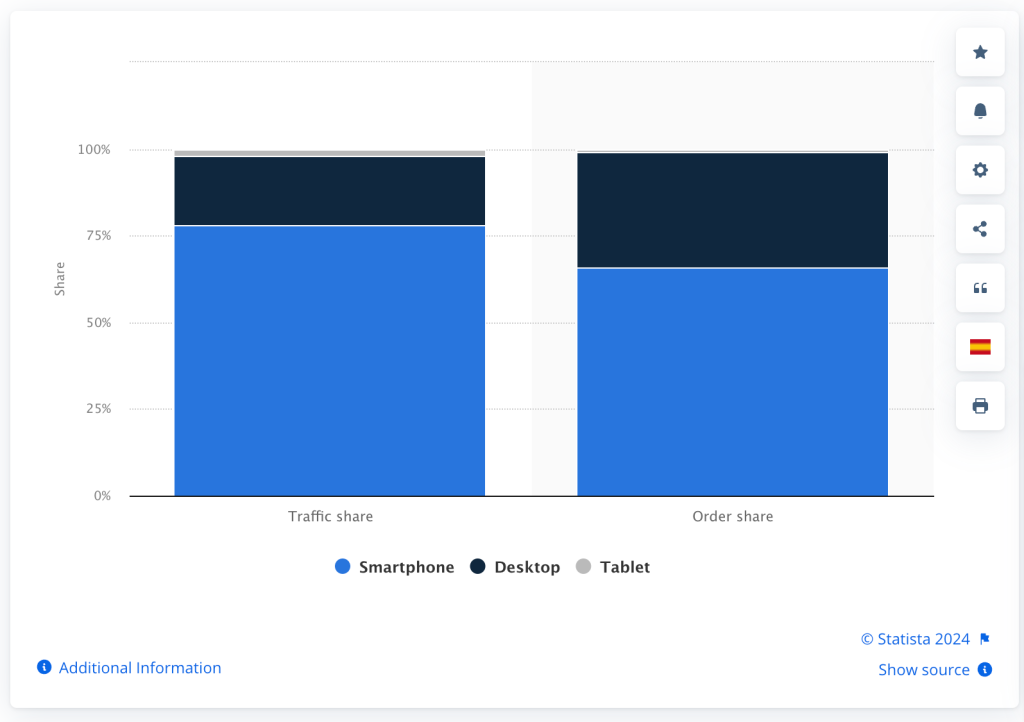
Mobiles are expected to dominate the global e-commerce traffic with a share of 78% compared to desktops and tablets.
In order share, there is a similar trend, with mobile phones dominating the market with a 66% share compared to desktops and tablets.
Around 65% of mobile users said they bought something because an influencer they liked suggested it.
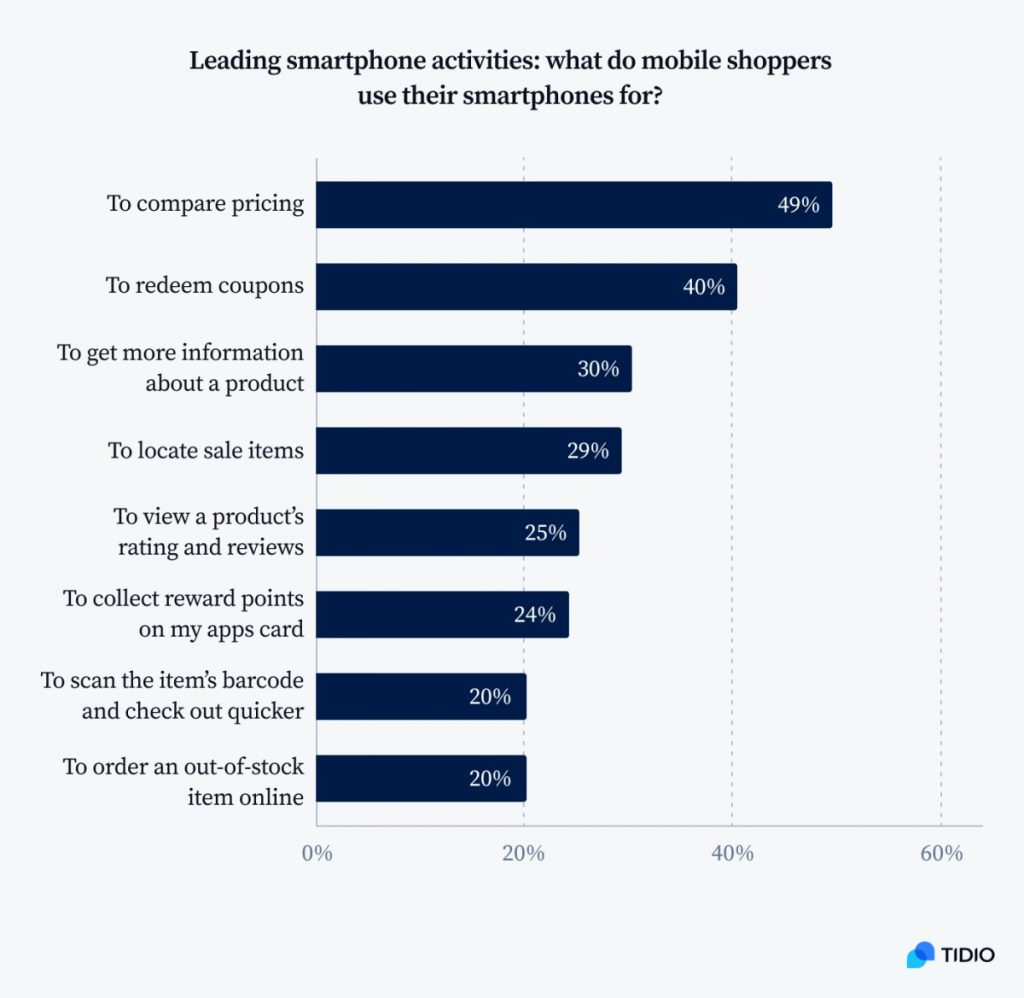
Nearly half the online shoppers use their mobile devices to compare prices for a product.
The 25-34 age group dominates the age demographic, consisting of the most mobile shoppers.
Viewing of products increases by a factor of 4.2x per session in mobile shopping apps compared to mobile websites for mobile users.
The average transaction value for mobile device shopping or transactions is $120 in 2025 through mobile wallets and other payment gateways.
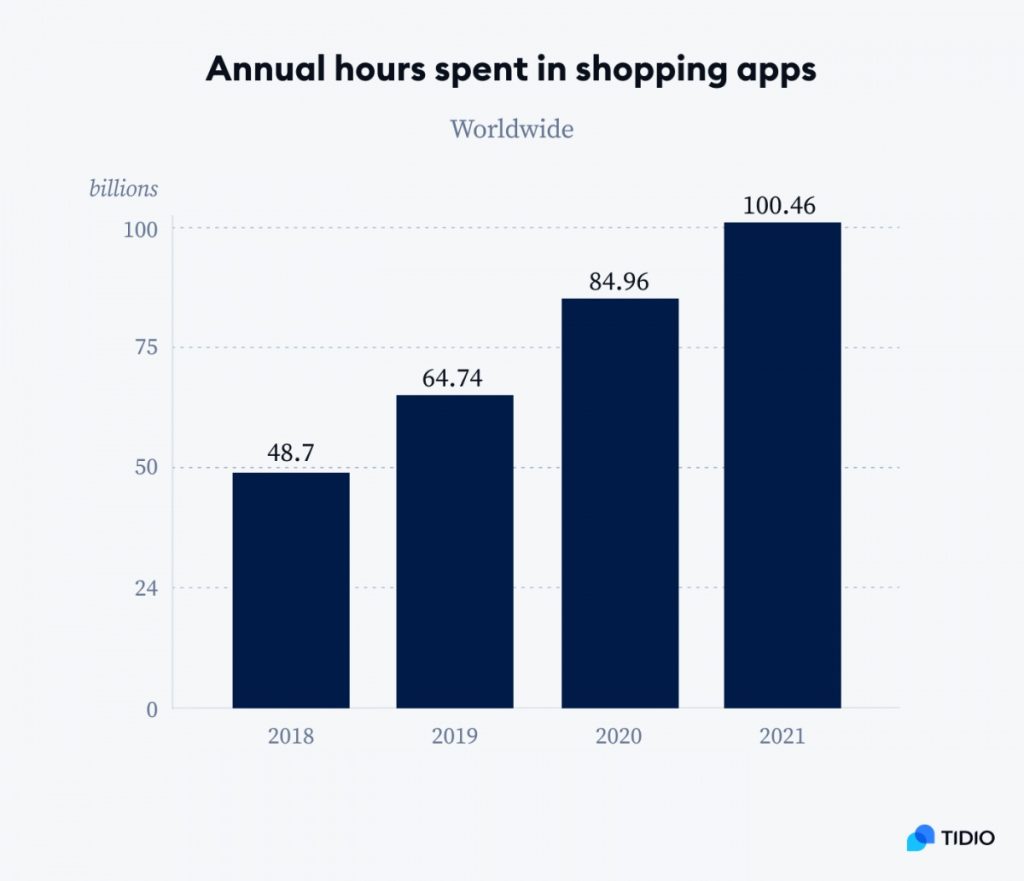
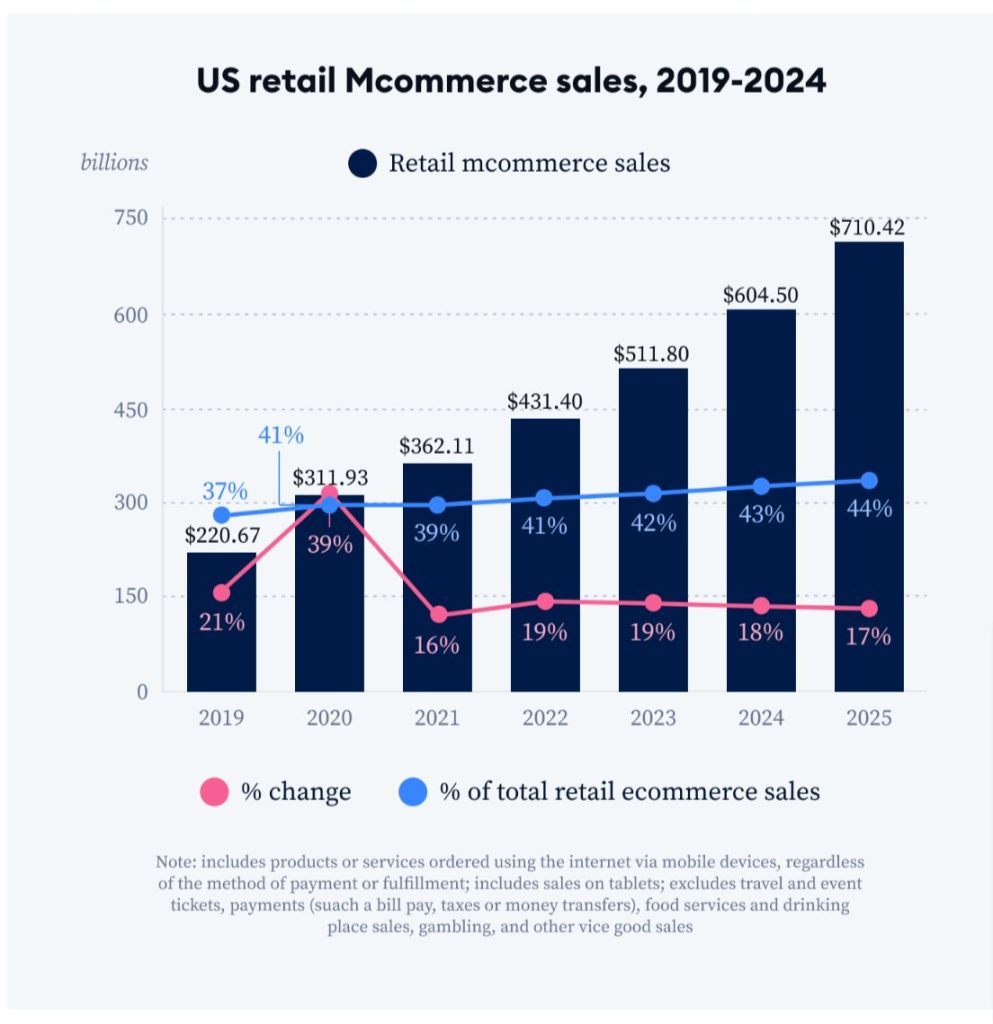
From 2023, there has been a steady and decent increase of 20% in mobile commerce sales in 2025.
Understanding Mobile Shopping Behavior
There are multiple reasons why customers have switched to mobile shopping recently.
Shopping on mobile is more convenient and easy compared to desktop shopping. Mobile app optimisation makes the experience more user-friendly for smartphone users and boosts mobile commerce sales.
Take a look at some of these stats to understand consumer shopping behaviour-
In 2025, there is a clear distinction in preference, as 70% of the purchases were made through a mobile app rather than a mobile website.
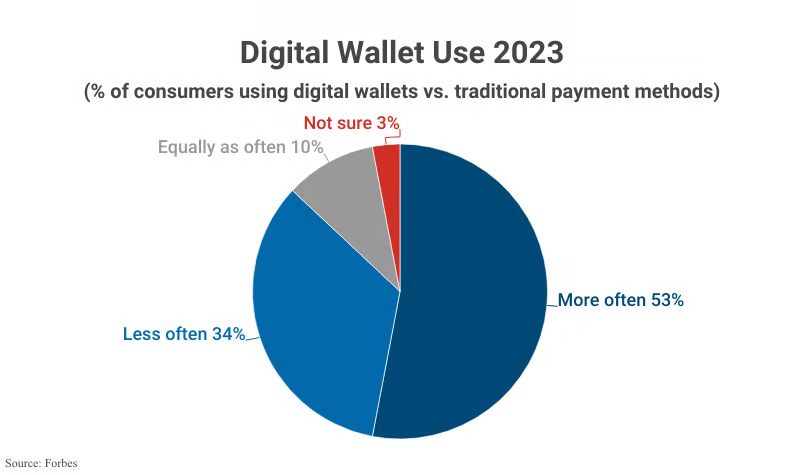
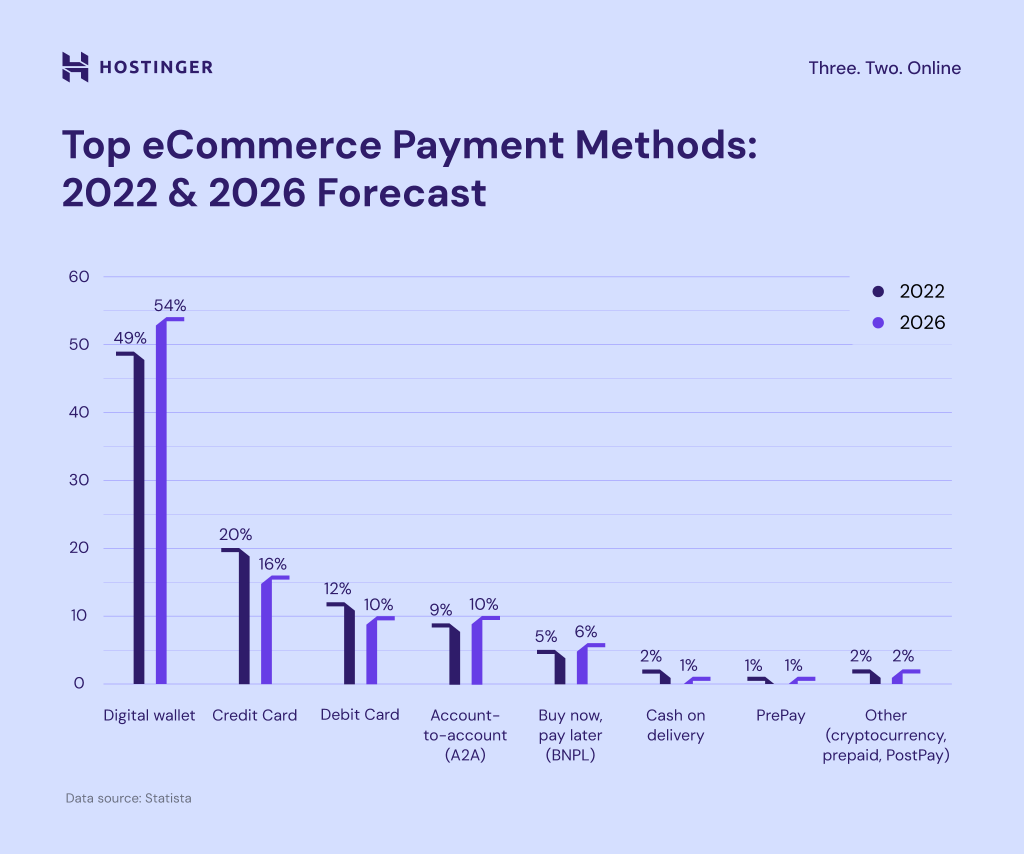
Digital and wallet payments have made it so convenient to shop that 49% of global transactions are made through these payment methods.
Comparing products from multiple sellers has made mobile shopping the most prominent method.
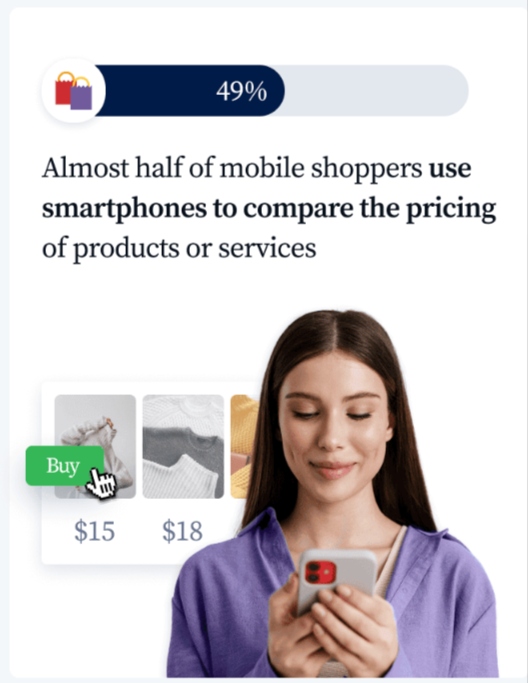
Almost 49% of online shoppers use their mobile devices to check and compare prices before making a purchase.
This trend highlights the growing importance of mobile phones in the shopping process, as they offer convenience and quick access to price information, helping shoppers make informed decisions.
This ease of comparing products and getting the best deal without leaving the comfort of your home is one of the key reasons why mobile shopping is increasing in popularity.
In the US, around 74% of people conduct product research on their devices, even when shopping in stores.
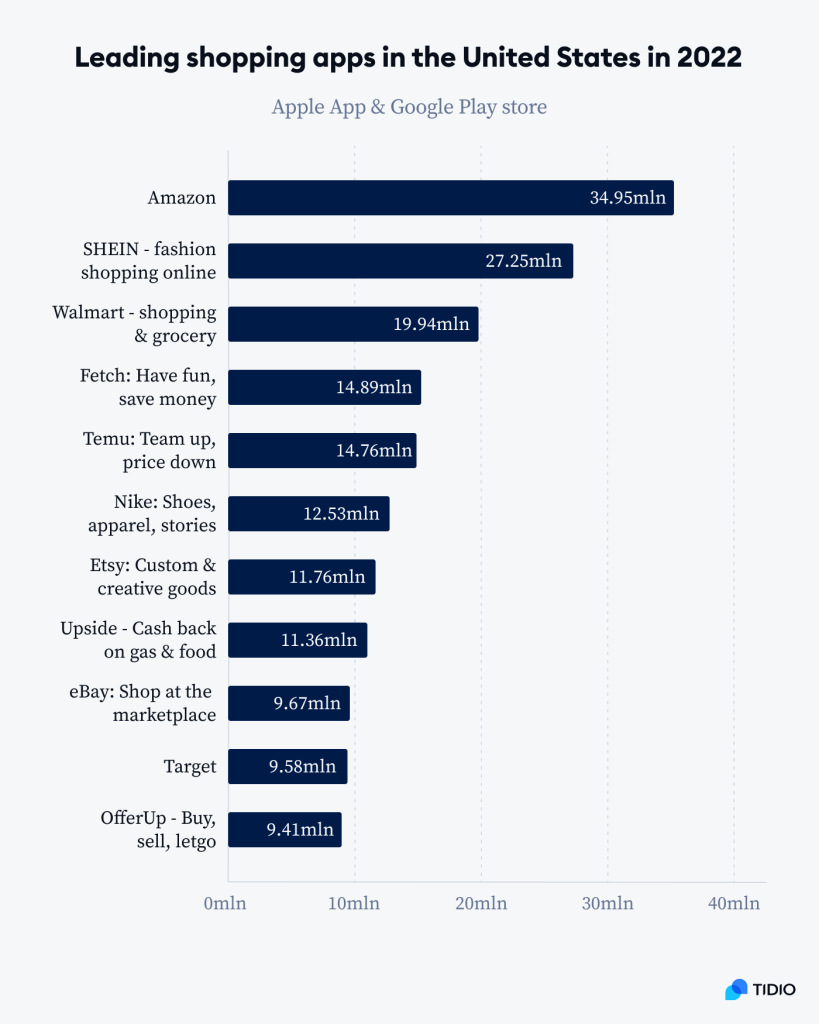
Shopping apps have the highest usage rate compared to other fields, such as sports apps, news apps, business and finance, etc.
Build trust & FOMO
Highlight real-time activities like reviews, sales & sign-ups.

Mobile Conversion Rates and Optimization
Mobile apps have proven time and again to have a much better engagement than traditional avenues. They consistently show higher engagement compared to traditional methods.
To optimise mobile conversion rates, businesses focus on improving user experience, simplifying navigation, and personalising content.
Effective strategies include fast loading times, clear calls to action, and seamless checkout processes. These efforts have helped convert more mobile users into customers, boosting overall mobile app success.
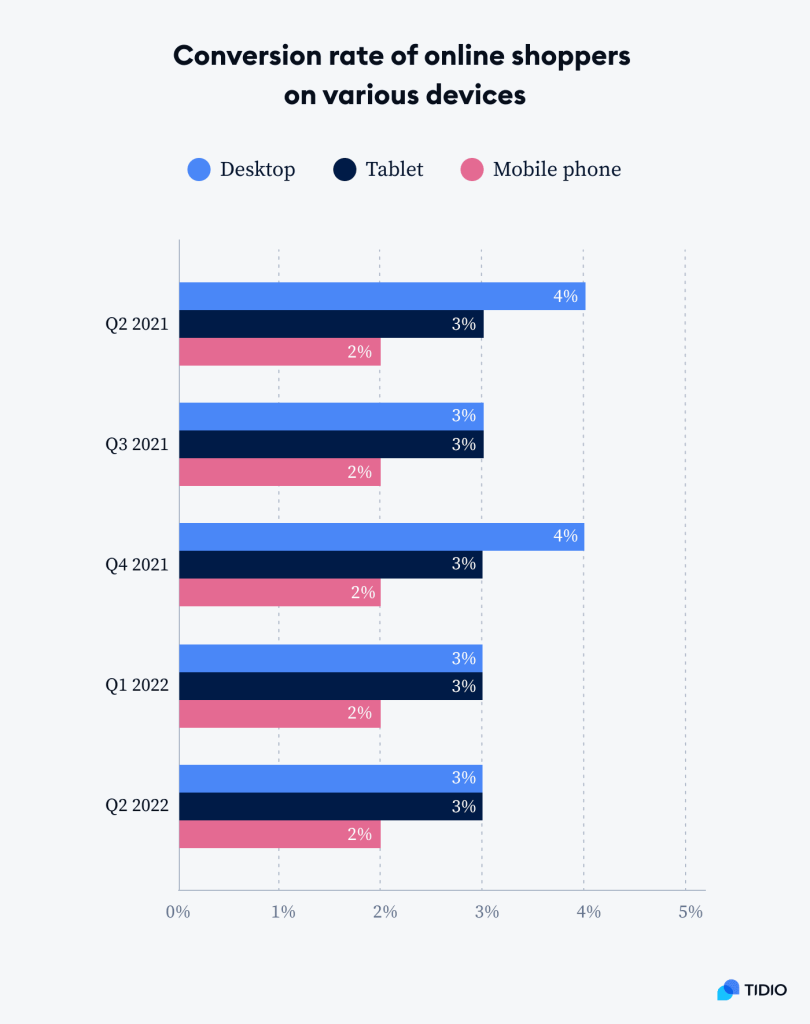
In 2025, mobile apps had a commerce sales conversion rate of 3.5%, which is much higher than the 2% conversion rate for mobile websites.
In terms of market share for orders, mobile users lead with 66%, dominating desktops and tablets.
In terms of market share, mobiles lead with 66%, dominating desktops and tablets. This trend is influenced by the user-friendly interfaces (UI/UX) of mobile devices.
People prefer the convenience and accessibility of smartphones for browsing, shopping, and social media.
The portability and constant technological advancements in mobiles also contribute to higher sales.
Additionally, many apps and websites are optimised for mobile use, making them more appealing to users. These factors collectively drive the dominance of mobile commerce.
Users view 4.2 times more products per session in mobile shopping apps compared to mobile websites.
Users view 4.2 times more products per session in shopping apps compared to mobile websites.
This is because shopping apps offer a better user experience with faster loading times and easier navigation.
Apps often have personalised recommendations and features that keep users engaged longer.
Additionally, apps can send push notifications about sales and offers, encouraging more browsing.
These factors make shopping apps more appealing, leading to increased product views per session on a mobile device.
Mobile apps have an average cart abandonment rate of 20%, much lower than desktop’s 68% and mobile website 97%.
A shopping app, on average, is 10% higher in order values
The Role of Social Media in Mobile e Commerce
Social media plays a crucial role in mobile e commerce, influencing how people shop and make purchasing decisions.
With the widespread use of smartphones, platforms like Facebook, Instagram, and Twitter have become essential tools for businesses to reach customers.
These platforms allow companies to showcase products, run targeted ads, and engage with their audience in real-time.
Users can easily browse, share, and buy products directly from their social media feeds. Thus making it more convenient and interactive for consumers.
In 2025, about 55% of shoppers said they bought something using a social media app. This shows how much these platforms affect how people shop.
In 2025, almost 40% of all mobile e commerce purchases happened directly through social media platforms.
Around 65% of shoppers said they bought something because an influencer they like suggested it.
Many consumers said they ended up buying a product or service because someone they admire, like an influencer, recommended it. Influencers have a big impact on what people decide to buy.
When they talk about a product on social media or in videos, it catches people’s attention.
Many shoppers trust influencers’ opinions and feel more confident about their purchases when they recommend something.
This shows how influential these personalities are in shaping consumer behaviour and driving sales through mobile commerce.
On social media apps, users typically spend around 30 minutes browsing products during each session.
Ads on social media helped boost e commerce sales, especially in mobile shopping, with a 4% rate of turning viewers and app users into buyers.
Mobile Payments Trends and Security
Mobile payments are becoming increasingly popular, but with this rise comes security concerns.
This has helped many online retailers use payment apps like Apple Pay or Google Pay to increase total retail sales.
As more people turn to their smartphones for transactions, understanding the latest trends and ensuring security measures are in place becomes crucial.
Take a look at a few stats outlining the mobile payment trends and security in 2025:
Build trust & FOMO
Highlight real-time activities like reviews, sales & sign-ups.

In 2025, the typical amount spent on mobile shopping is $120 per transaction.
In 2025, the average amount spent on each purchase made through mobile shopping is $120.
This indicates a significant level of consumer spending on mobile platforms for buying various goods and services.
It reflects the growing trend of people trusting smartphone platforms for payments and security.
This number has constantly increased over the past few years.
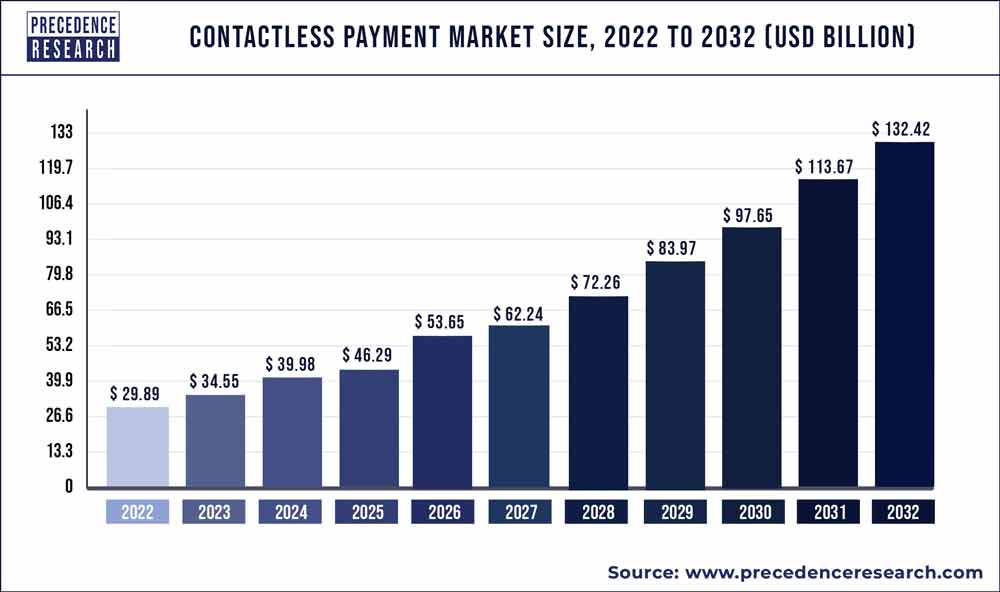
In 2025, about 60% of consumers said they used contactless payment at least once a month.
Since 2023, there has been a consistent and notable rise of 20% in mobile ecommerce sales in 2025.
The growth rate of mobile commerce from 2023 to 2025 has been remarkable.
In total, mobile sales saw a 20% increase year-over-year, showing that more and more people are choosing to shop through their mobile devices.
This trend indicates a strong preference for the convenience and accessibility of mobile shopping among consumers.
It suggests that optimising mobile app platforms for users has led to an increase in mobile ecommerce.
Around 10% of mobile transactions 2025 used biometric authentication methods like fingerprint and facial recognition.
Cryptocurrencies are starting to become more popular in mobile shopping, making up about 2% of transactions in 2025.
Future Trends in Mobile Commerce
Future trends in mobile commerce point towards continued growth and innovation in online shopping.
With the increasing reliance on smartphones for daily activities, such as shopping, banking, and communication, mobile commerce is set to expand further.
One notable trend is the rise of mobile payment options like digital wallets and contactless payments, which offer convenience and security.
Additionally, augmented reality (AR) and virtual reality (VR) technologies are being used in many shopping apps.
They enhance the mobile shopping experience, allowing consumers to visualise products before making a purchase.
Moreover, personalised recommendations and AI-driven chatbots are expected to play a significant role in improving customer engagement and satisfaction in the mobile commerce landscape.
Most mobile shoppers belong to the age group of 25 to 34 years old.
The age group of 25 to 34 years old stands out as the largest among mobile shoppers. This trend could be due to various factors.
People in this age range are often tech-savvy and comfortable with using smartphones for online purchases.
They might also have higher disposable incomes, making them more inclined to engage in mobile commerce.
Additionally, this demographic group is likely to be more familiar with digital trends and comfortable with navigating mobile apps and websites and online shopping, contributing to their dominance in mobile commerce.
Mobiles are projected to lead global e-commerce traffic, capturing 78% of the market share, surpassing desktops and tablets.
In 2025, experts think that buying stuff on phones will keep getting more popular. T
hey say that in North America, about 70% of online shopping is done on mobiles.
Build trust & FOMO
Highlight real-time activities like reviews, sales & sign-ups.

And in Asia, it’s expected to stay high, with about 85% of online sales being done on phones.
In Europe, it’s a bit behind but still growing, with about 60% of online shopping happening on mobiles.
In 2025, there are new things and technologies that will change how we buy stuff using our phones.
Augmented Reality (AR) is going to change how we shop. It lets you see products virtually before buying them.
Imagine trying on clothes without actually putting them on! And with 5G internet, shopping on your phone will be even faster and more reliable.
This will make mobile shopping even more popular.
Most people who shop on their phones are between 25 and 34 years old. They make up the biggest chunk of phone shoppers.
The age group of 25 to 34-year-olds is leading the way when it comes to shopping on mobile devices.
They’re the ones who do the most shopping using their phones.
This trend is likely to continue into the future, with more and more people of this age group turning to their mobile devices for shopping.
As technology advances and mobile apps become more user-friendly, we can expect even greater growth in mobile commerce among this age group.
By the end of 2025, it’s predicted that sales from shopping on mobiles will reach new heights in the field of mobile e-commerce.
Wrapping Up
Mobile commerce today is a booming industry that is growing at a fast pace. The future of phone shopping looks really promising.
The big changes happening in technology are going to make a huge difference for internet users.
This means that buying stuff on your mobile browser will become even easier and better, making customers really happy when they shop online.
According to mobile commerce statistics in 2025, it’ll be exciting to see how much mobile shopping has changed and improved.
Boost Conversion Instantly
Add Social Proof & Urgency to your website
Sources
Also, Read these stats if interested
24 Impactful Black Friday Statistics
50+ Ecommerce Personalization Statistics & Trends