
50 Ecommerce Personalization Stats & Trends (2026)

Shoppers expect personalization, and most say they walk away when a store feels generic. Personalization lifts revenue for the stores that get it right, and AI is now doing a growing share of that work.
But the numbers also show a widening trust gap. Many shoppers find personalization pushy or creepy when it ignores what they want right now.
Below are 50 current ecommerce personalization statistics, grouped by the question each one answers, followed by the trends shaping the next year.
Key takeaways
- 71% of shoppers expect personalized interactions, and 76% get frustrated without them.
- Personalization typically lifts revenue 5% to 15% and can cut acquisition costs by up to half.
- AI-referred shoppers now convert better than other traffic, and AI influenced $262 billion of 2025 holiday sales.
- Only 15% of consumers fully trust brands with their data, so transparency and control matter as much as relevance.
What Are the Key Personalization Stats?
Ten numbers that sum up where ecommerce personalization stands right now.
| Metric | Latest figure | Source |
|---|---|---|
| Shoppers who expect personalization | 71% | McKinsey |
| Shoppers frustrated without it | 76% | McKinsey |
| Shoppers who abandon irrelevant experiences | 71% | Twilio, 2025 |
| More likely to buy with real-time personalization | 88% | Twilio, 2025 |
| Brands seeing higher spend from personalization | 75% | Twilio, 2025 |
| Typical revenue lift | 5% to 15% | McKinsey |
| Customers who find personalization negative | 53% | Gartner, 2025 |
| 2025 holiday sales driven by AI and agents | 20%, $262 billion | Salesforce |
| Growth in AI traffic to US retail sites | 693% | Adobe, 2025 holiday |
| Consumers who fully trust brands with their data | 15% | Twilio, 2025 |
Do Shoppers Expect Personalization?
Yes. Personalization is no longer a nice extra. It is the baseline shoppers expect, and most notice quickly when a store gets it wrong.
1. 71% of consumers expect companies to deliver personalized interactions, according to McKinsey.
2. 76% get frustrated when that doesn’t happen, McKinsey found.

3. 76% of consumers say personalized communication makes them more likely to consider buying from a brand, per McKinsey.

4. 78% are more likely to buy again from brands that personalize, McKinsey reports.
5. 71% of consumers will walk away from a purchase if the experience doesn’t feel relevant, according to Twilio’s 2025 State of Customer Engagement report.
The gap between expectation and delivery is where stores lose sales. Fixing it starts with your own site, so here is how website personalization works in practice.
How Much Does Personalization Lift Sales?
The revenue case is well studied, and it holds across industries. The size of the lift depends on how well a store executes.
6. Personalization lifts revenue by 5% to 15% for most companies, according to McKinsey.
7. It also improves marketing return on investment by 10% to 30%, McKinsey found.
8. Personalization can cut customer acquisition costs by up to 50%, per McKinsey.
9. Fast-growing companies drive 40% more of their revenue from personalization than slower-growing peers, McKinsey reports.
10. 75% of brands that personalize see customers spending more, according to Twilio’s 2025 report.
11. 88% of consumers are more likely to buy when personalization happens in real time, but only 44% of brands say they can deliver it, Twilio found.
12. Best-in-class retailers achieve revenue lifts of 25% or more from personalization, yet only 19% of retailers reach that tier, according to BCG.
13. Another 40% of retailers see lifts of 10% or more from basic personalization, BCG found.
14. Top retailers on BCG’s Personalization Index could unlock an estimated $570 billion in incremental growth by putting first-party data to work.
15. Customers who experienced personalization in a recent purchase were 1.8 times more likely to pay a premium, according to Gartner.
Build trust & FOMO
Highlight real-time activities like reviews, sales & sign-ups.


What Do Shoppers Want Personalized?
Shoppers aren’t asking for their first name in an email. They want help choosing, offers that fit, and messages that arrive at the right moment.
16. 67% of consumers want relevant product or service recommendations, according to McKinsey.
17. 66% want messaging tailored to their needs, McKinsey found.
18. 65% want targeted promotions, per McKinsey.
19. Automated email flows, which trigger on each shopper’s behavior, drive 41% of email revenue from just 5.3% of sends, according to Klaviyo’s 2026 benchmarks.
20. Those flows earn nearly 18 times more revenue per recipient than one-size-fits-all campaigns, Klaviyo reports.
Recommendations are usually the first place personalization pays off. These product recommendation examples show how stores put them to work.
How Is AI Changing Personalization?
AI went from a personalization tool to a shopping channel of its own in under two years. Shoppers now ask AI assistants what to buy, and those visitors arrive ready to purchase.
21. 56% of brands now use AI to tailor experiences, from recommendations to dynamic offers, according to Twilio’s 2025 report.
22. 96% of companies say AI is improving customer-facing work such as support, marketing, and personalization, Twilio found.
23. Over 70% of brands agree AI adoption will fundamentally change their personalization and marketing strategies, according to Twilio Segment.
24. AI and agents drove 20% of all retail sales in the 2025 holiday season, worth $262 billion, according to Salesforce.
25. Shoppers referred by AI search converted nine times more often than shoppers from social media, Salesforce found.
26. Retailers with their own AI shopping agents grew holiday sales 59% faster than those without, 6.2% versus 3.9%, per Salesforce.
27. Shoppers used retailers’ AI agents for customer service 126% more during the holiday rush than in the two months before, Salesforce reports.
28. Traffic from generative AI tools to US retail sites grew 693.4% year over year in the 2025 holiday season, according to Adobe.
29. AI referrals converted 31% better than other traffic sources, nearly doubling year over year, Adobe found.
30. Revenue per visit from AI traffic rose 254% during the holiday season, per Adobe.
31. Between January and July 2025, revenue per visit from AI traffic was 84% higher than from non-AI sources, Adobe reports.
32. AI-referred visitors spent 45% more time on retail sites and viewed 13% more pages per visit, according to Adobe.
33. On Thanksgiving, AI-referred visits converted 54% better than other traffic, and 38% better on Black Friday, Adobe found.
34. Amazon’s AI shopping assistant, Rufus, was used by more than 300 million customers in 2025 and drove nearly $12 billion in incremental annualized sales, according to Amazon.
35. Rufus users are 60% more likely to complete a purchase, Amazon reports.
36. Rufus monthly active users grew 115% year over year in the first quarter of 2026, Amazon said.
Do Shoppers Trust Personalization?
Shoppers will trade data for relevance, but the trade has conditions. Most want to know what you collect and to stay in control of it.
37. 90% of consumers trust at least some brands, but only 15% absolutely trust brands with their data, according to Twilio’s 2025 report.
38. 61% don’t believe brands use their data in the customer’s best interest, Twilio found.
39. 84% want control over their own personalization settings, per Twilio.
40. 54% want to know when they’re talking to AI instead of a person, Twilio reports.
41. 55% say they’re tired of hearing about AI, according to Twilio.
When Does Personalization Backfire?
Personalization that ignores context reads as pressure, not help. Gartner’s research shows how often that happens.
42. Personalized marketing creates a negative experience for 53% of customers, according to Gartner.
43. Those customers were 3.2 times more likely to regret a purchase, Gartner found.
44. They were also 44% less likely to buy from the brand again, per Gartner.
45. Customers who experienced personalization were twice as likely to feel overwhelmed by the amount of information they received, Gartner reports.
46. Active personalization, which asks shoppers about their goals instead of guessing, made customers 2.3 times more likely to confidently complete a purchase decision, according to Gartner.
The fix is not less personalization. It is personalization that stays current, respects context, and gives shoppers visible control.
Is Customer Data Holding Brands Back?
Personalization is only as good as the data behind it. Many brands think they know their customers better than they do.
47. 83% of business leaders say they deeply understand their customers, according to Twilio’s 2025 report.
48. Only 45% of consumers feel understood by the brands they buy from, down from 46% in 2024, Twilio found.
49. 61% of companies worry that inaccurate data will undermine their AI-driven personalization, according to Twilio Segment.
50. 89% of business leaders say personalization is key to their success over the next three years, Twilio Segment reports.
What Are the Top Personalization Trends for 2026?
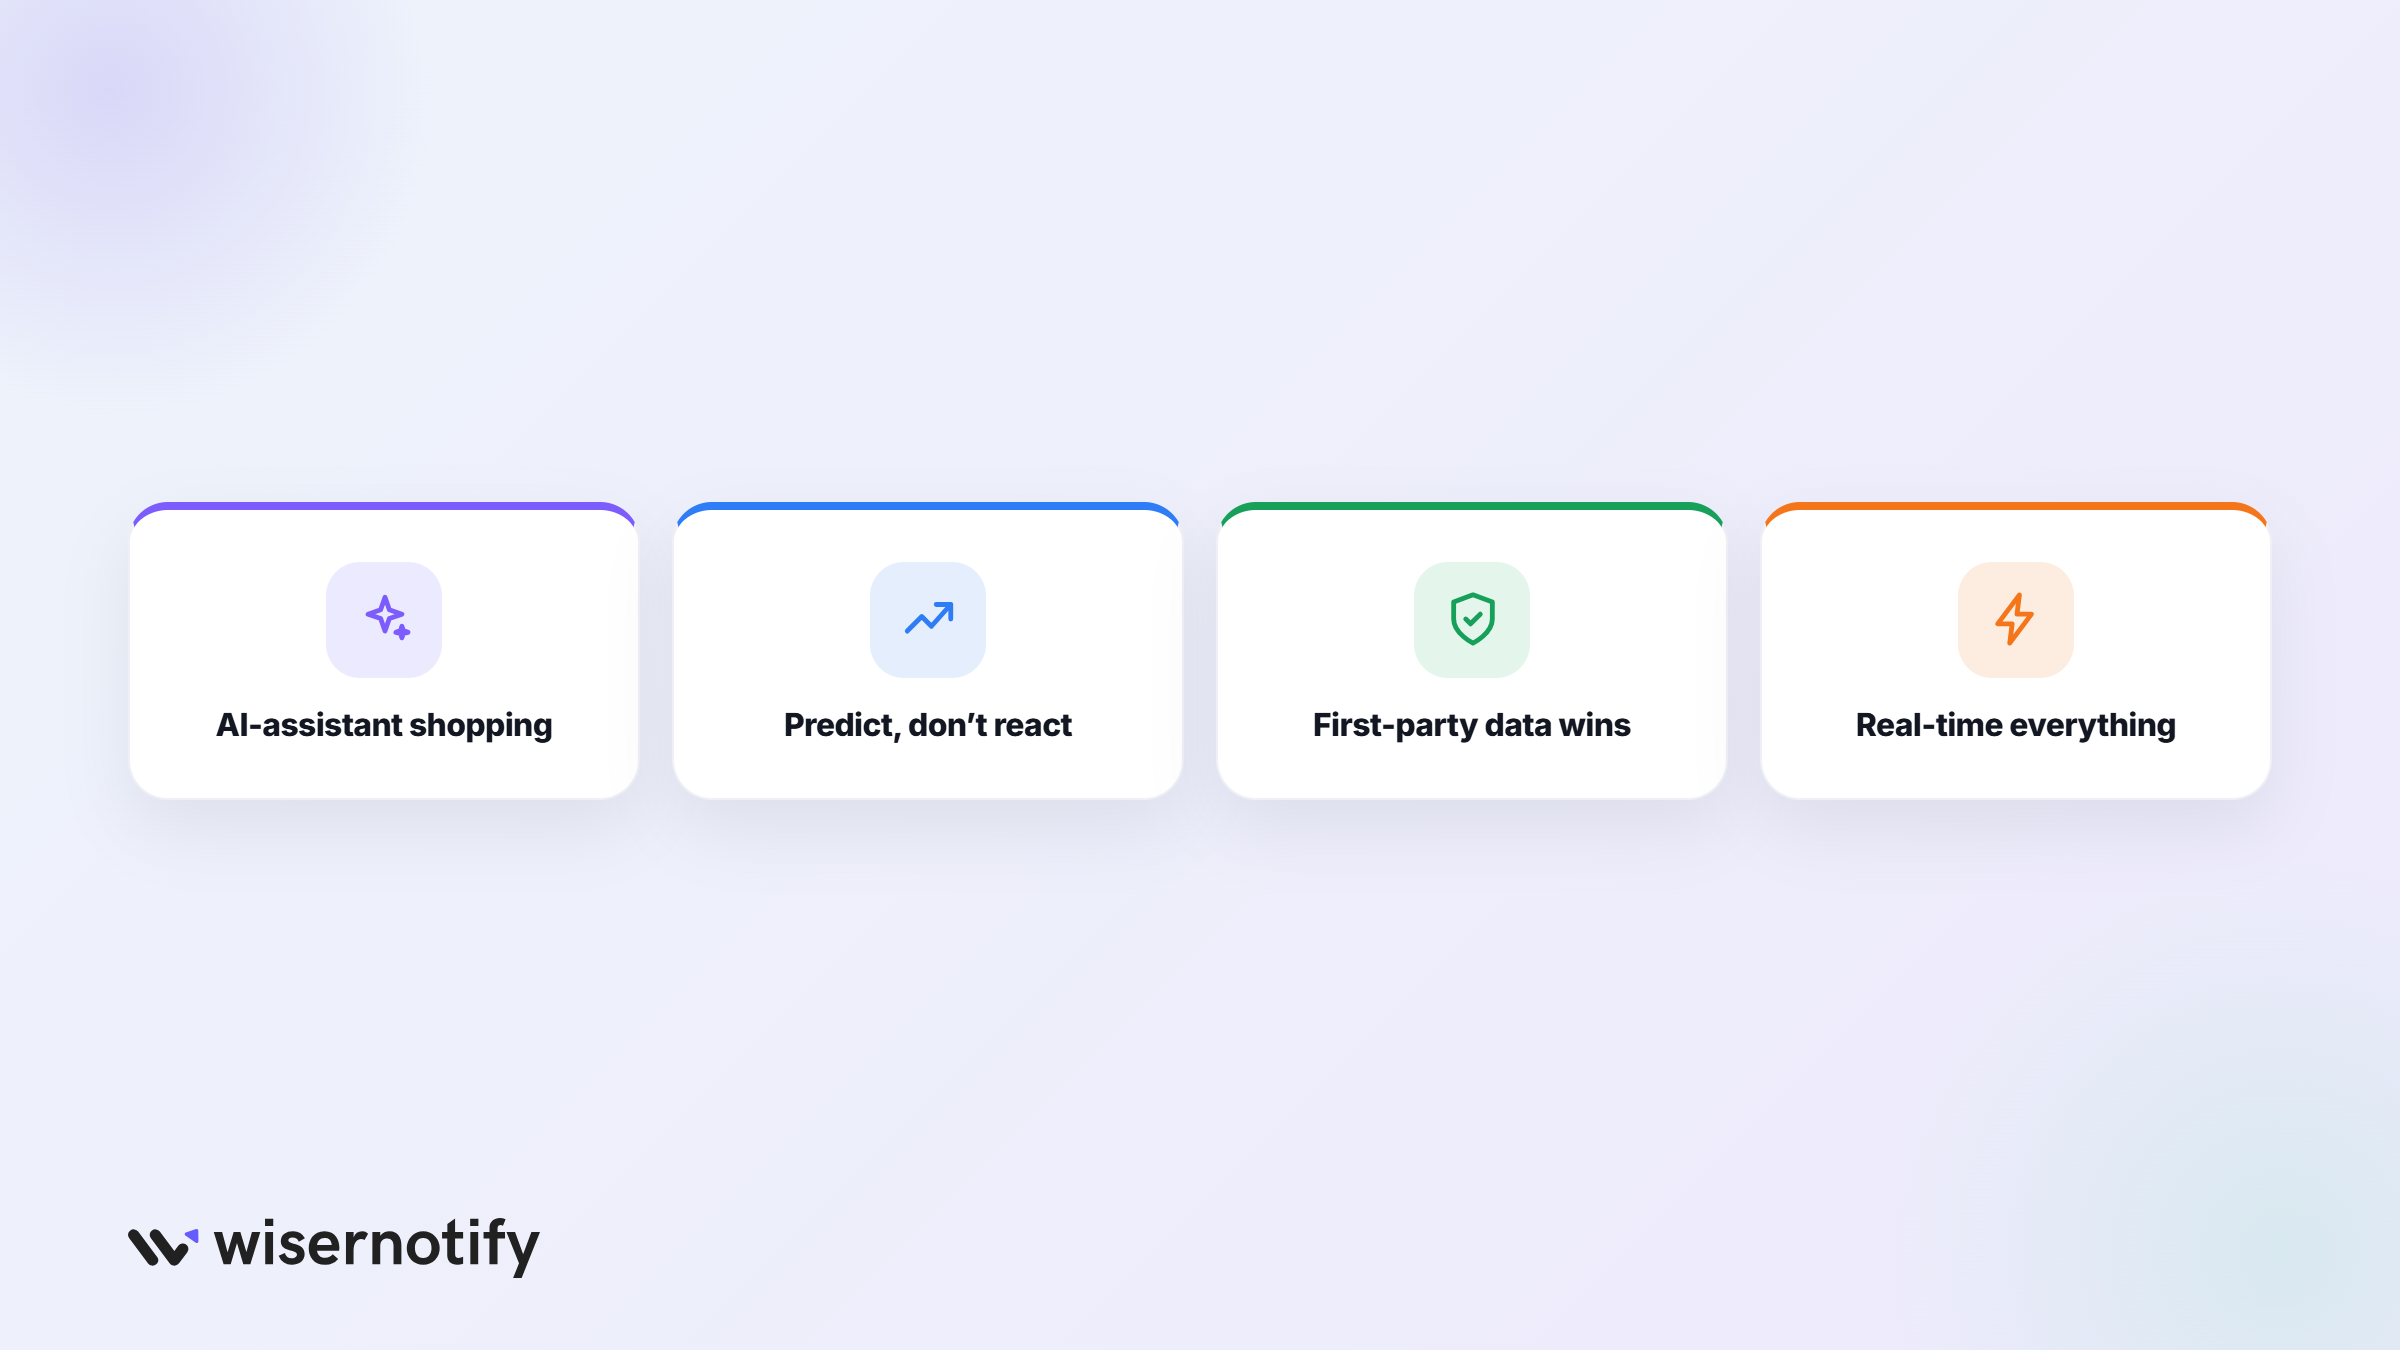
Five shifts are shaping ecommerce personalization right now, and each one shows up in the numbers above.
1. Shopping Through AI Assistants
Shoppers increasingly start with ChatGPT, Gemini, or a store’s own assistant instead of a search box. Those visitors convert better than most channels, so getting products and reviews into AI answers is becoming its own discipline.
2. Retailers Building Their Own Agents
Amazon’s Rufus showed what a store-owned assistant can do, and other retailers are following. A brand agent can answer questions, compare products, and handle returns using what it already knows about the shopper.
3. Real-Time Over Batch
Shoppers respond to what is happening now, not to a segment built last month. Live recommendations, current offers, and fresh activity on the page beat static personalization.
4. Asking Instead of Guessing
Quizzes, preference centers, and simple “what are you shopping for?” prompts let shoppers tell you what they want. This active approach feels less creepy and helps more people decide.
5. First-Party Data and Shopper Control
With trust low, stores that collect data directly and explain how they use it hold the advantage. Giving shoppers control over their settings turns personalization from surveillance into service.
Real-time social proof fits all five trends. WiserNotify shows live purchases, reviews, and visitor activity to each shopper as they browse, and these social proof statistics show why it works.

Boost Conversion Instantly
Add Social Proof & Urgency to your website
Wrap Up
Shoppers want stores that know them, and they reward the ones that get it right. They also leave the ones that feel pushy or careless with their data.
Start with what matters most: relevant recommendations, timely messages, and honest control over data. For the wider market picture, see these online shopping statistics.
Sources
McKinsey | Twilio | Twilio Segment | Gartner | BCG | Salesforce | Adobe | Amazon | Klaviyo
Frequently Asked Questions
What percentage of customers expect personalization?
71% of consumers expect personalized interactions, and 76% get frustrated when brands don’t deliver them, according to McKinsey.
How much does personalization increase sales?
Most companies see a revenue lift of 5% to 15%, along with lower acquisition costs and better marketing returns.
What are the top ecommerce personalization trends?
Shopping through AI assistants, store-owned AI agents, real-time personalization, asking shoppers what they want, and first-party data with shopper control.
Can personalization hurt sales?
Yes, when it feels pushy or out of context. Gartner found it creates a negative experience for 53% of customers.
Do shoppers trust brands with their data?
Most trust some brands, but only 15% fully trust brands with their data, so be clear about what you collect and let shoppers control it.

Krunal Vaghasiya is a marketing tech expert who boosts e-commerce conversion rates with automated social proof and FOMO strategies. He loves to keep posting insightful posts on online marketing software, marketing automations, and improving conversion rates.




 Capterra