
31 Omnichannel Statistics and Trends for 2026
Omnichannel stopped being a buzzword a while ago. In the 2025 and 2026 data, it’s simply how people shop. They find a product on their phone, check it on social media, and finish the purchase wherever it’s easiest.
Most retail money still moves through physical stores. Online keeps growing faster, though, and AI assistants have become a new place where shopping journeys start.
Below are 31 current omnichannel statistics, grouped by channel, followed by the trends behind them and what they mean for a store with one website.
Key Omnichannel Statistics
| Metric | Figure |
|---|---|
| Share of US retail sales made online, Q2 2026 | 17.1% |
| US ecommerce growth, Q2 2026 vs Q2 2025 | 12.2% |
| Spend of omnichannel shoppers vs single-channel shoppers | Nearly 2x |
| Mobile share of US online holiday spending, 2025 | 56.4% |
| Online holiday orders picked up in store, 2025 | About 1 in 5 |
| Social media share of online holiday revenue, 2025 | 4.6% |
| Email revenue from automated flows | About 41% |
| Holiday retail sales influenced by AI and agents, 2025 | 20% |
| AI-referred retail traffic growth, May 2026 | 138% |
| Customers who say experience matters as much as products | 88% |
How Shoppers Mix Channels
People rarely stick to one channel from first look to checkout. These numbers show how spending splits between online and offline, and who spends the most.
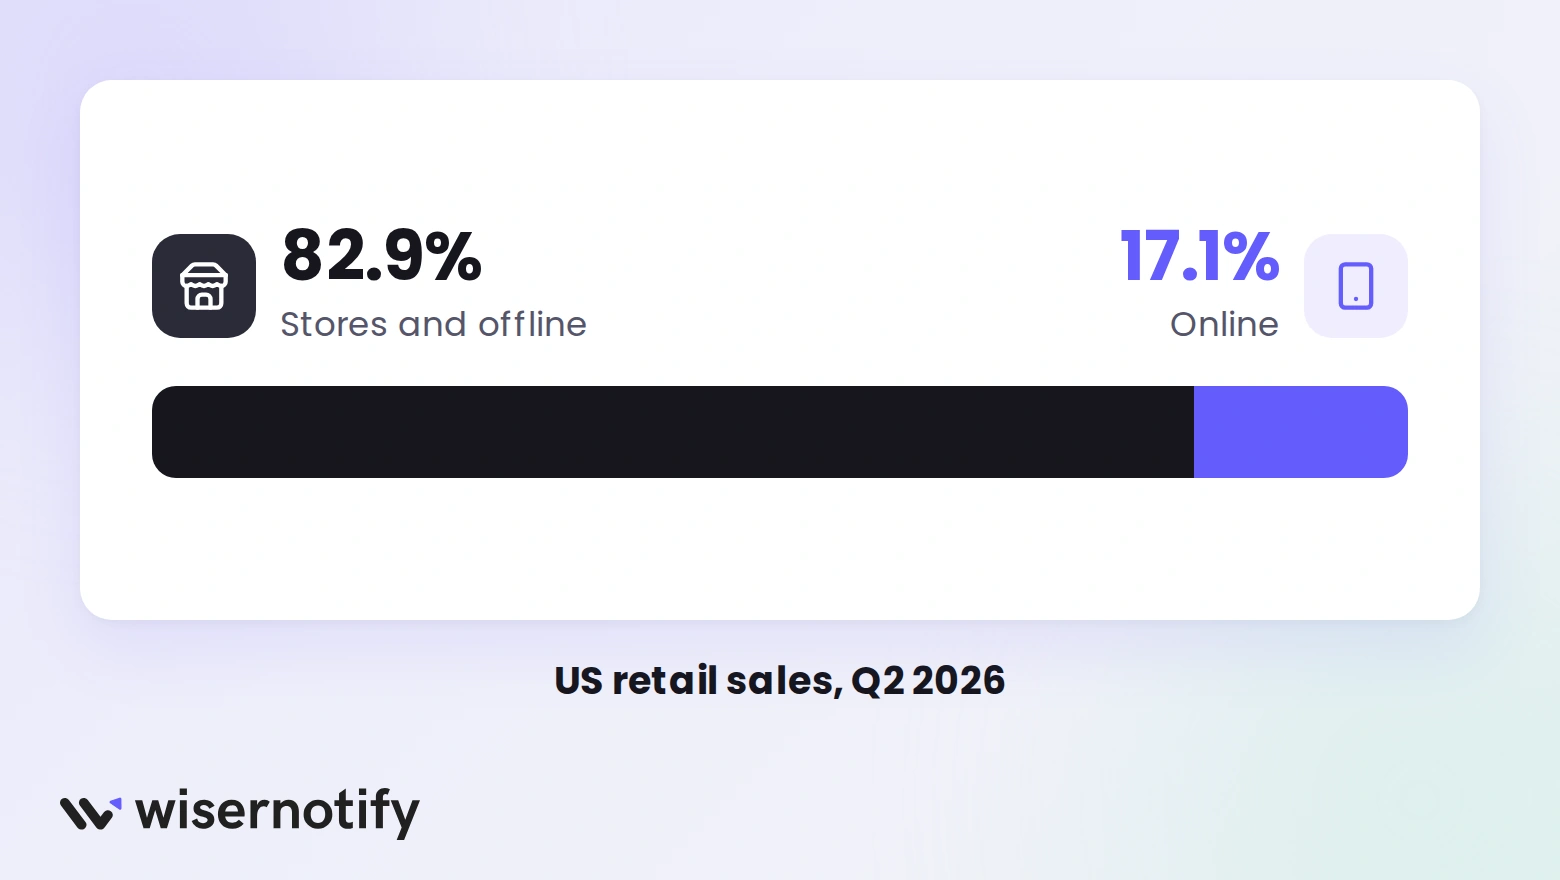
1. Ecommerce made up 17.1% of US retail sales in the second quarter of 2026. That means 82.9% of retail spending still went through stores and other offline channels.
2. Online is still the faster-growing side. US ecommerce sales rose 12.2% year over year in Q2 2026, while total retail grew 6.7%.
3. The average US household shopped at 39 different retailers in 2025, counting both online and in-store visits.
4. Shoppers who buy both online and in store spend nearly twice as much as shoppers who stick to only one of the two, according to 2025 household research.
5. For the 2025 holidays, 74% of US shoppers planned to buy in store, 73% on marketplaces, 70% on brand websites, 50% in brand apps, and 23% on social media marketplaces.
6. Global online sales hit $1.29 trillion over the 2025 holiday season, including $294 billion in the US.
7. Loyalty is easy to lose. In a 2022 global survey, 71% of consumers said they had switched brands at least once in the previous year.
Marketplaces are one of the biggest channels in that mix. Our Amazon statistics show how much of online retail runs through a single marketplace.
Build trust & FOMO
Highlight real-time activities like reviews, sales & sign-ups.


Mobile and Social Commerce Statistics
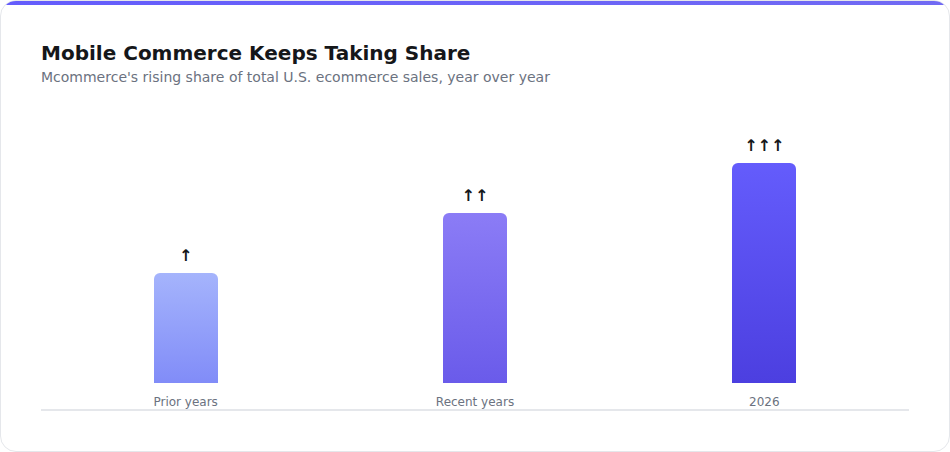
The phone is where most online journeys now start and finish. Social platforms and creators sit on top of that, sending traffic and sales to stores.
8. Smartphones drove 56.4% of US online holiday spending in 2025, up from 54.5% a year earlier.
9. Mobile peaked on Christmas Day 2025, when it accounted for 66.5% of online sales.
10. Phones drove most of the holiday spending in 2025, but only 38.8% of returns that season were started on a mobile device.
11. Social media’s share of online holiday revenue reached 4.6% in 2025, up 40.3% year over year.
12. Affiliates and influencers drove 20.4% of online holiday revenue in 2025, up 15.9% year over year.
If you’re picking where to sell on social, this guide to the best social commerce platforms compares the main options.
Build trust & FOMO
Highlight real-time activities like reviews, sales & sign-ups.
Store Pickup and Returns Statistics
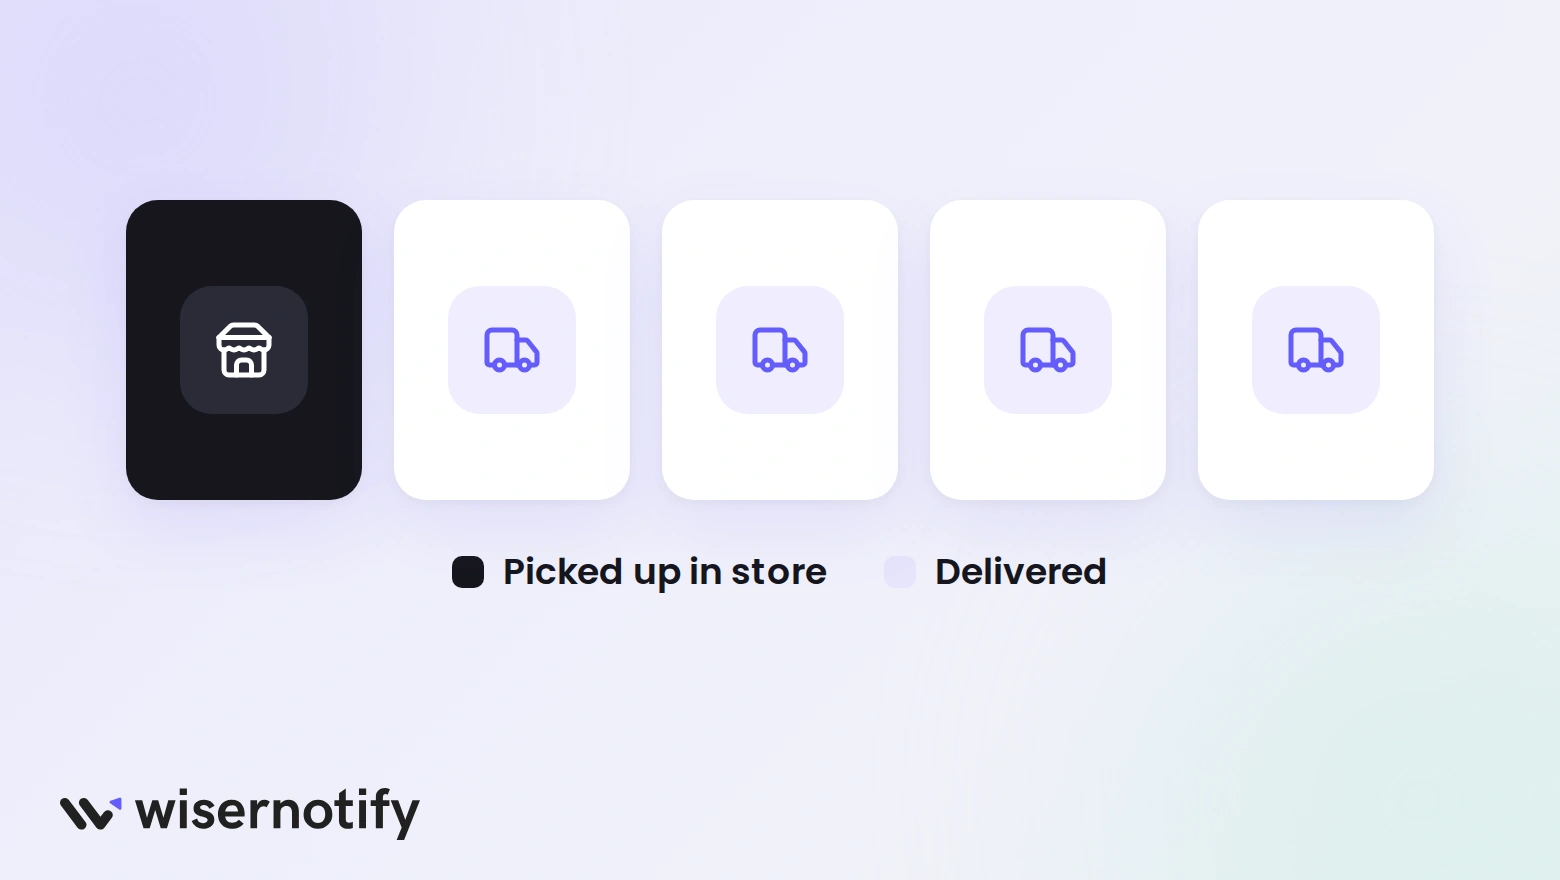
Physical stores now do double duty as pickup and return points for online orders. For many shoppers, the reason is simply cost.
13. Nearly one in five online holiday orders in 2025 was placed as buy online, pick up in store.
14. Pickup peaked on December 22, 2025, when 35% of all online orders were set for in-store collection.
15. Curbside pickup was used in 17.1% of online holiday orders in 2025 at retailers that offer it, down slightly from 17.5% in 2024.
16. Among shoppers who picked up online orders in store, 71% did it to avoid shipping fees, up 8 points from the year before (2025 survey).
17. 54% of US consumers prefer to return items in store, all year round, according to the same 2025 survey.
Email, SMS, and Automation Statistics
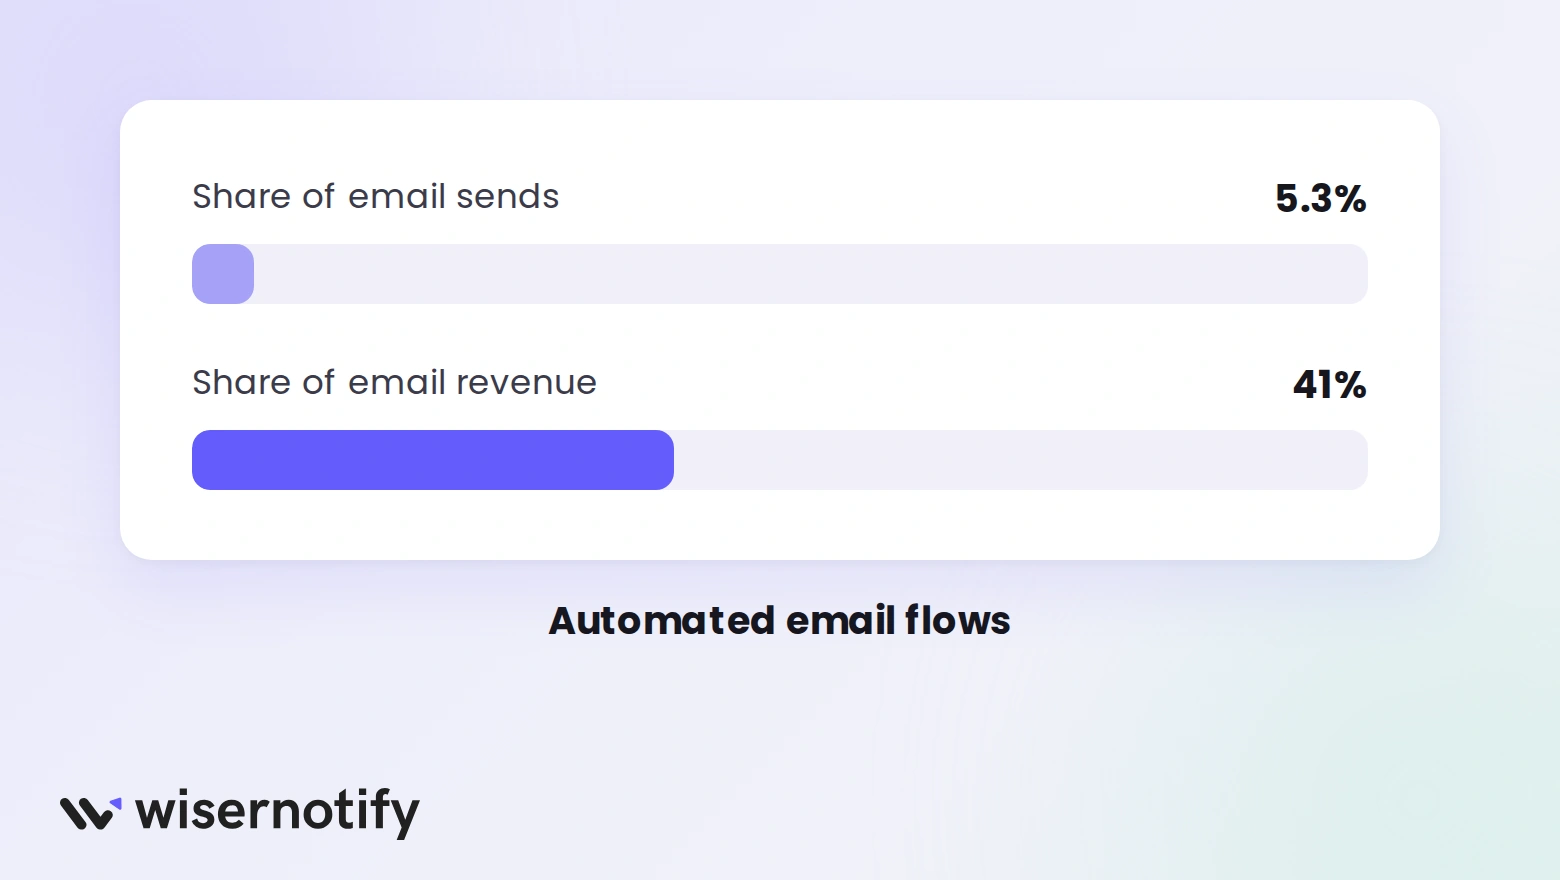
Automated messages tied to what a shopper just did now carry most of the revenue in email and SMS. Scheduled blasts still make up most of the volume, but they earn far less per send.
18. Across 183,000+ brands, automated email flows made up 5.3% of sends but drove about 41% of email revenue (2026 benchmarks).
19. Revenue per recipient from those flows was nearly 18 times higher than from one-off campaigns.
20. SMS shows the same pattern. Automated SMS flows were 7.6% of SMS sends and 45.2% of SMS revenue.
21. Across 150,000 brands in 2025, email automations were just 2% of sends but produced 30% of email revenue, earning 16 times more per send than campaigns.
22. Ecommerce email open rates rose to 30.7% in 2025, and click-to-conversion rates climbed from 5.9% to 9%.
Email and SMS bring people back. For the paid side of the same job, see our retargeting statistics.
Customer Expectation Statistics
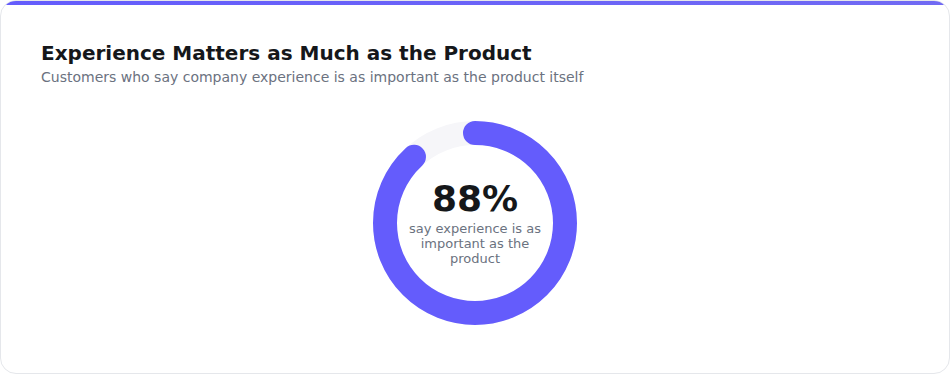
Expectations travel with the shopper from channel to channel. These figures come from large surveys run in 2021 and 2022, and they are still the most-cited data on the topic.
23. 88% of customers said the experience a company provides is as important as its products or services, the highest share recorded at the time (2022).
24. 73% of customers expected companies to understand their unique needs and expectations (2022).
25. 61% of consumers were comfortable with companies using their personal information when it’s done transparently and to their benefit, up from 52% in 2020 (2022).
26. 71% of consumers expected personalized interactions, and 76% got frustrated when they didn’t get them (2021 survey).
For more on service and support expectations, our customer experience statistics go deeper.
Build trust & FOMO
Highlight real-time activities like reviews, sales & sign-ups.
Omnichannel Trends for 2026
The numbers above point to five shifts that are shaping how stores sell this year.
1. AI Assistants Become a Channel
Shoppers now ask ChatGPT, Gemini, and retailers’ own assistants what to buy, and then click through to a store. That makes AI a channel in its own right, with its own traffic and conversion rates.
27. AI tools and agents influenced 20% of global retail sales over the 2025 holidays, about $262 billion.
28. Retailers that deployed their own AI agents grew holiday sales 6.2% year over year, compared with 3.9% for those that didn’t.
29. Traffic from AI sources to US retail sites rose 693.4% over the 2025 holiday season.
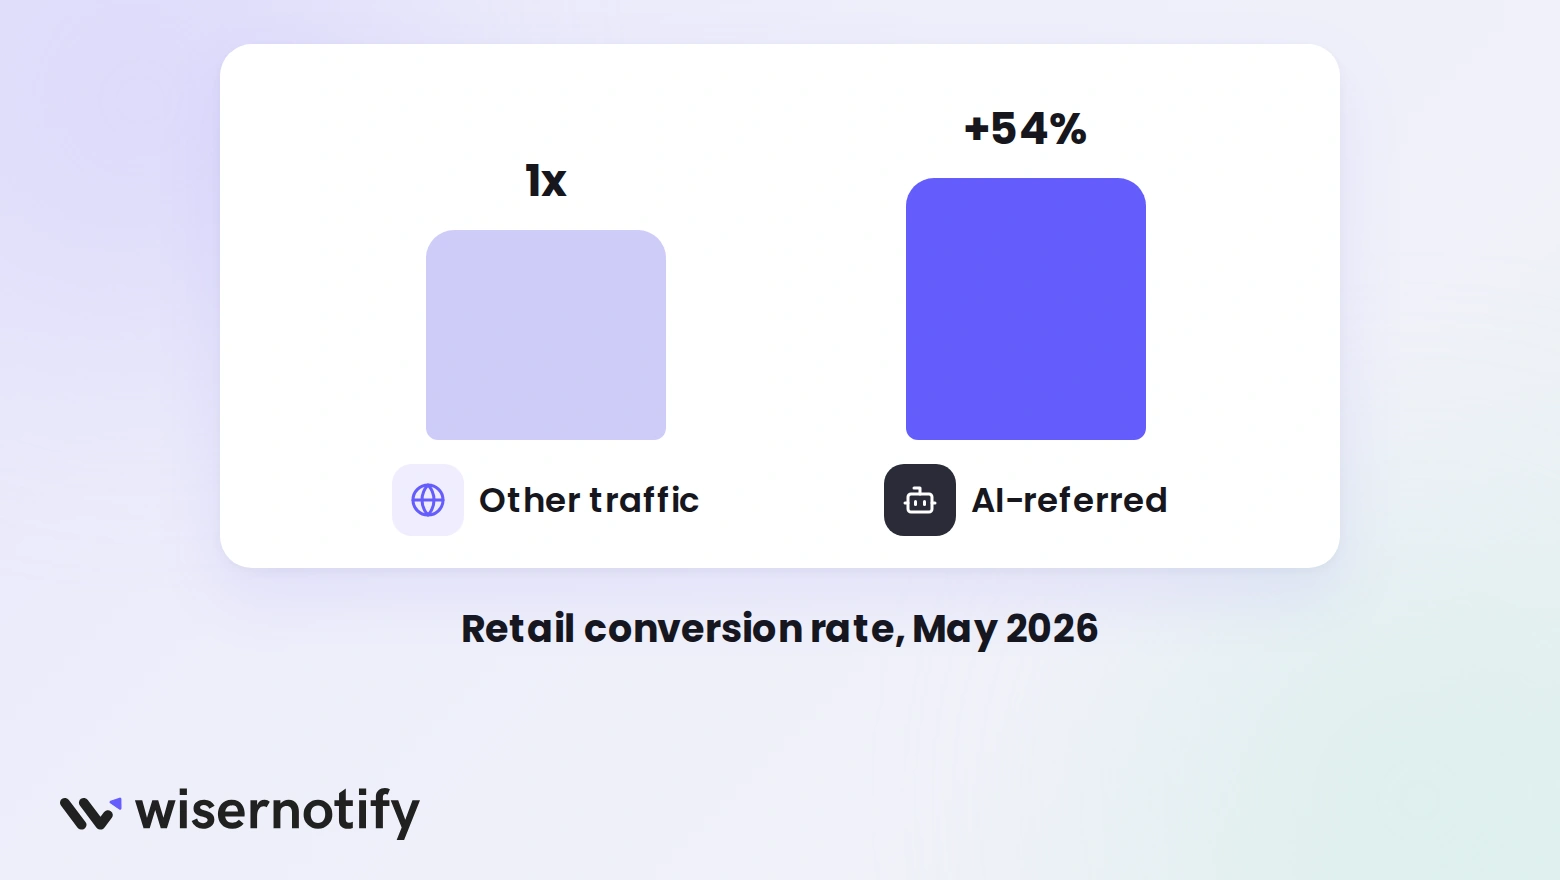
30. In May 2026, AI-referred retail traffic was up 138% year over year and converted 54% better than traffic from other sources.
31. AI-referred visits were also worth 53% more per visit than non-AI visits in May 2026.
2. Stores Turn Into Pickup Points
Shoppers use stores to skip shipping fees and to return things quickly. Retailers with a physical location are treating the counter as part of the online checkout, not a separate business.
For brands without a store, the lesson is the same. Make delivery costs and returns clear before checkout, because that’s what pickup customers are reacting to.
3. Social and Creators Drive Discovery
Social platforms still bring a small share of revenue, but it’s growing faster than almost any other source. Creator and affiliate links already carry a much larger share.
That shifts where trust gets built. Shoppers see a product in a creator’s video, then look for the same proof on your site before they buy. See our UGC statistics for how customer content affects that decision.
4. Automation Over Batch Campaigns
Triggered flows, like a welcome series, browse follow-ups, and abandoned cart reminders, earn far more per message than newsletters. Brands are building those first and sending fewer blasts.
The flows also connect channels. An email can follow a website visit, and an SMS can follow an unopened email, which is omnichannel in practice for most small teams.
5. Mobile Is the Main Storefront
With most online spending now on phones, the mobile product page is effectively the store. Speed, clear prices, and visible reviews on small screens decide whether a visit turns into a sale.
What Omnichannel Means for a Single-Site Store
You don’t need a store, an app, and five ad platforms to benefit from these numbers. For a founder with one website, omnichannel mostly means making that site carry the trust built everywhere else.
- Treat your site as the landing point. Whether someone comes from a creator, a search, or an AI assistant, they end up on your product page.
- Bring off-site proof onto the page. Reviews from Google or marketplaces, recent orders, and customer photos reassure people who found you somewhere else. Our online review statistics show how much weight shoppers put on them.
- Automate follow-ups before adding channels. A welcome flow and an abandoned cart flow will usually earn more than a new social account.
- Make product pages easy for AI to read. Clear product names, specs, prices, and review markup help assistants describe and recommend you.
- Keep details consistent everywhere. Prices, stock, and return terms should match across your site, marketplaces, and social shops.
- Show activity that happens on other channels. A live notification of a recent purchase or a fresh review tells new visitors the store is busy. These social proof statistics explain why that works.

Boost Conversion Instantly
Add Social Proof & Urgency to your website
Wrap Up
Omnichannel in 2026 comes down to meeting shoppers where they already are and keeping the experience the same once they reach you.
For most growing stores, that starts with the website. Make it the place where every channel’s trust shows up, and the other channels get easier to add.
Sources
U.S. Census Bureau | Adobe Holiday Shopping Report | Adobe AI Traffic Report | Salesforce Holiday Shopping Data | Salesforce State of the Connected Customer | Circana | Ryder | Klaviyo | Omnisend | McKinsey
Frequently Asked Questions
What percentage of retail sales are online in 2026?
Ecommerce made up 17.1% of US retail sales in the second quarter of 2026, so most spending still happens in stores.
Do omnichannel shoppers spend more?
Yes. Shoppers who buy both online and in store spend nearly twice as much as those who use only one channel, according to 2025 household research.
What are the biggest omnichannel trends for 2026?
AI assistants becoming a shopping channel, stores doubling as pickup and return points, creator-led social discovery, and automated email and SMS flows.
What's the difference between omnichannel and multichannel?
Multichannel means selling on several channels that run separately. Omnichannel connects them, so prices, stock, and the customer’s history carry over from one channel to the next.
How can a small store use omnichannel?
Make your website show proof from other channels, like reviews and recent orders, and automate follow-up emails and texts before adding new channels.

Krunal Vaghasiya is a marketing tech expert who boosts e-commerce conversion rates with automated social proof and FOMO strategies. He loves to keep posting insightful posts on online marketing software, marketing automations, and improving conversion rates.




 Capterra