Ever wondered where your website visitors are looking, clicking or getting stuck? Trying to increase conversions but guessing what changes to make. You’re not alone.
Many businesses face these challenges and the answer might be in the power of heatmaps.
Heatmaps are like X-rays for your website, showing you the hidden patterns of visitor behaviour.
With these visual representations of user interaction provided by a website heatmap tool, you can gain valuable insights into how people are engaging with your content, and find areas to improve and optimize your website for better results.
In this guide, we’ll be exploring the world of heat mapping and 12 tools (free and paid) that will change the way you think about your website visitors.
Here’s a quick summary of the tools:
1. Microsoft Clarity: Free tool with heatmaps, session replays and insights into user interaction for website optimisation.
2. Lucky Orange: Free platform with heatmaps, session recordings, live chat and conversion funnels to understand and engage visitors.
3. Plerdy: Free tool with heatmaps, pop-up forms and SEO analysis to boost website performance and conversions.
4. LogRocket: Session replays, logs errors and analytics to identify and fix issues affecting user experience.
5. Zipy.ai: AI powered platform for session replays, user behaviour analysis and conversion optimisation with heatmaps and funnel analysis.
6. Smartlook: Always-on visitor recordings and heatmaps with advanced filtering to analyse user behaviour and improve UX.
7. Zoho Pagesense: Part of the Zoho suite, it has heatmaps, A/B testing, funnel analysis and form analytics for website optimisation.
8. Freshworks: Customer engagement platform with heatmaps and session replays within its Freshmarketer product for marketing optimisation.
9. Heatmap.com: Dynamic heatmaps and session recordings for understanding user behaviour and optimising websites and apps.
10. Attention Insight: Attention heatmaps, predicting visual attention on webpages to optimise design and content placement.
11. Contentsquare: Advanced platform for understanding user behaviour with heatmaps, session replays and customer journey analytics.
12. EmailHeatmaps.com: Heatmaps for email campaigns, tracking clicks and engagement to optimise email marketing performance.
Start Free Trial
Highlight real-time activities like reviews, sales & sign-ups.


What is Heatmap Software?
Using color-coded visual representations of user activity on your website or app, you may analyze user behavior using heatmap software.
It helps data analysts, user experience researchers, web designers, and marketing professionals learn more about their target audience.
Heatmap software uses features like click tracking, scroll maps, user session recording, and device tracking to analyze user behavior.
Definition and Purpose of Heatmap Software
Heatmap software is designed to provide insights into how users interact with your website or app, helping you identify areas of improvement and optimize your digital product for a better user experience.
By analyzing user behavior, heatmap software enables you to make data-driven decisions and improve your website’s usability, conversion rates, and overall performance.
Types of Heatmaps: Click, Scroll, Move, Engagement Zone, and Rage Click Maps
There are several types of heatmaps that can be used to analyze user behavior, including:
- Click maps: Show where users click on a page or screen, helping you understand which elements are most engaging.
- Scroll maps: Indicate how far users scroll on a page, revealing whether important content is being seen.
- Move maps: Track where users move their mouse on a page, providing insights into their navigation patterns.
- Engagement Zone maps: Combine information from click, scroll, and move maps to show areas of high user engagement.
- Rage click maps: Highlight areas where users are clicking excessively, indicating frustration or confusion.
Benefits of Using Heatmap Software for Web Page Optimization
Using heatmap software can bring numerous benefits to your web page optimization efforts, including:
- Improved user experience: By identifying areas of high user engagement and optimizing your website accordingly.
- Increased conversions: By streamlining your website’s layout and making it easier for users to complete their desired actions.
- Enhanced decision-making: By providing data-driven insights into user behavior and preferences.
- Better understanding of user behavior: By analyzing user interaction patterns and identifying areas for improvement.
Heatmap Software Features
Session recordings and event tracking
Go beyond static heatmaps by using a website heatmap tool to watch actual user sessions.
You’ll see exactly how users are navigating your website and where the friction is and where the opportunities are.
Event tracking lets you track specific interactions like button clicks or form submissions.
Funnel analysis and conversion rate measurement
See the steps users take to complete key actions on your website.
See where users drop off in your conversion funnels and optimise those pages to increase conversions.
Track your conversion rates over time to see the impact of your changes.
User journey mapping and drop-off analysis
See the paths users take through your website and where they exit.
See common drop-off points and why users are leaving so you can make targeted changes to keep them engaged.
Google Analytics integration and compatibility
Integrate your heatmap data with Google Analytics to get more insight into your website performance.
Combine heatmap insights with other analytics data to get the full picture of user behaviour.
Custom event tracking and API access
Track custom events beyond standard clicks and scrolls.
For example you could track interactions with specific elements on your page or trigger events based on user behaviour.
API access allows developers to extract and analyse heatmap data programmatically.
Free Heat Mapping Tools
1. Microsoft Clarity
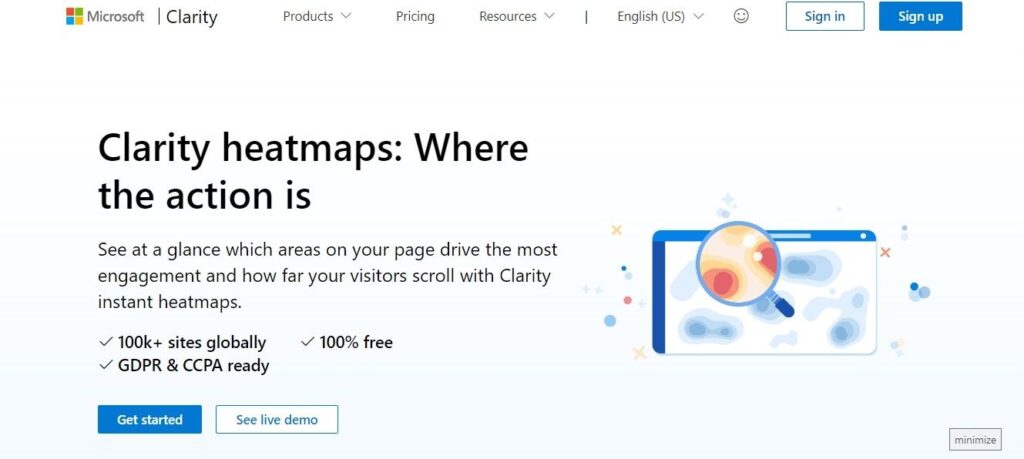
Microsoft Clarity offers a powerful website heatmap tool, providing invaluable insights into user behavior through its advanced heatmapping capabilities.
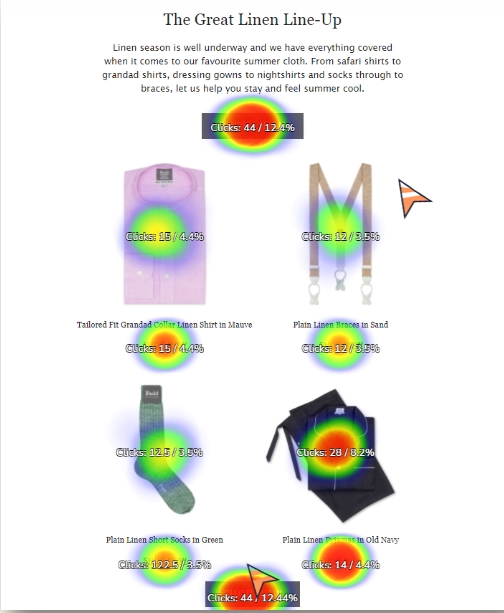
Heatmaps act as a visual representation of user engagement, highlighting the areas of your website that attract the most attention, clicks, and scrolling activity.
With Clarity, you can easily generate heatmaps for individual pages or across your entire site, revealing hidden patterns and potential areas for improvement.
Whether you’re looking to optimize your site’s layout, enhance user experience, or boost conversions, Microsoft Clarity’s heatmapping feature is an essential tool for unlocking the secrets of user behavior.
Features and Integrations:
👉 Click, scroll and move heatmaps
👉 Session recordings
👉 Basic filtering and segmentation
👉 Google Analytics and CMS integrations
Pros
- Easy to set up and use
- Has core heatmap software features
- Integrates with Google Analytics
Cons
- Limited features compared to paid tools
- Not suitable for large websites or complex analysis
Best for:
- Small to medium-sized businesses
- Simple user flows
- New to heatmapping
Pricing:
- Free
2. Lucky Orange
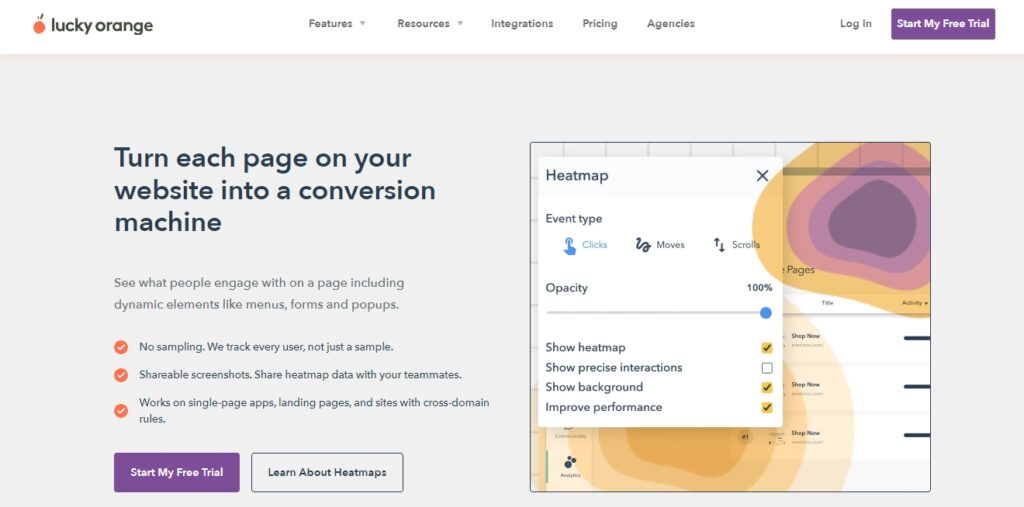
Lucky Orange is a powerful website heatmap tool and conversion optimization tool that helps you understand how visitors interact with your website.
Its heatmapping feature visually represents where users click, move their mouse, and scroll, providing valuable insights into what captures their attention and what might be causing friction.
This will help you see where users are struggling, where the opportunities are and make informed decisions to improve your website.
Features and Integrations:
👉 Dynamic heatmaps
👉 Session recordings with click and scroll data
👉Live chat for real-time visitor interaction
👉Conversion funnels and form analytics
👉E-commerce and marketing platform integrations
Pros
- Full feature set
- Live chat boosts user engagement
- Powerful conversion optimisation
Cons
- Can be overwhelming for beginners
- Pricing higher than some competitors
Best for:
- Businesses that prioritise user engagement and conversion optimisation
- E-commerce websites looking to increase sales
- Companies looking for a multi-functional tool
Pricing:
- Free plan available
- From $32 per month
3. Plerdy
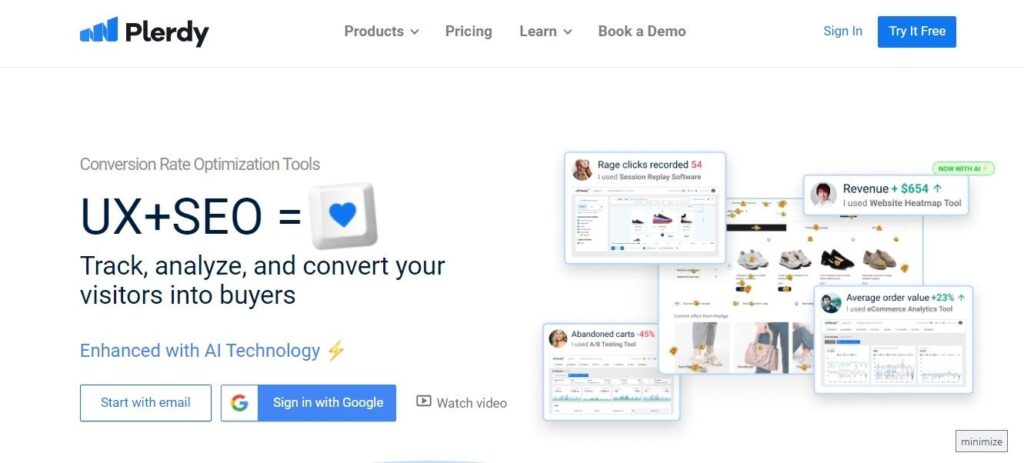
Plerdy is a website heatmap tool that will help you to maximise your online presence and understand your website visitors behaviour.
It gives you insight into user behaviour so you can see where the problems are and make informed decisions to improve your website.
Use Plerdy to track user sessions, see click maps and capture user activity.
With this data you can find bottlenecks, improve user experience and eventually increase conversions.
Features and Integrations:
👉 Heatmaps, scroll maps and click maps
👉 Session replays with advanced filtering
👉 Conversion funnels and event tracking
👉 SEO checker and content analysis
👉 Google Analytics, Google Tag Manager and more integrations
Pros
- Deep user interaction analysis
- SEO and content optimisation features
- Suitable for small and large websites
Cons
- Interface not as intuitive as some competitors
- Pricing higher for smaller businesses
Best for:
- Businesses looking for advanced analytics and optimisation
- Marketers focused on SEO and content
- Complex user flows and conversion paths
Pricing:
- Free plan available
- From $21 per month
Start Free Trial
Highlight real-time activities like reviews, sales & sign-ups.

4. LogRocket
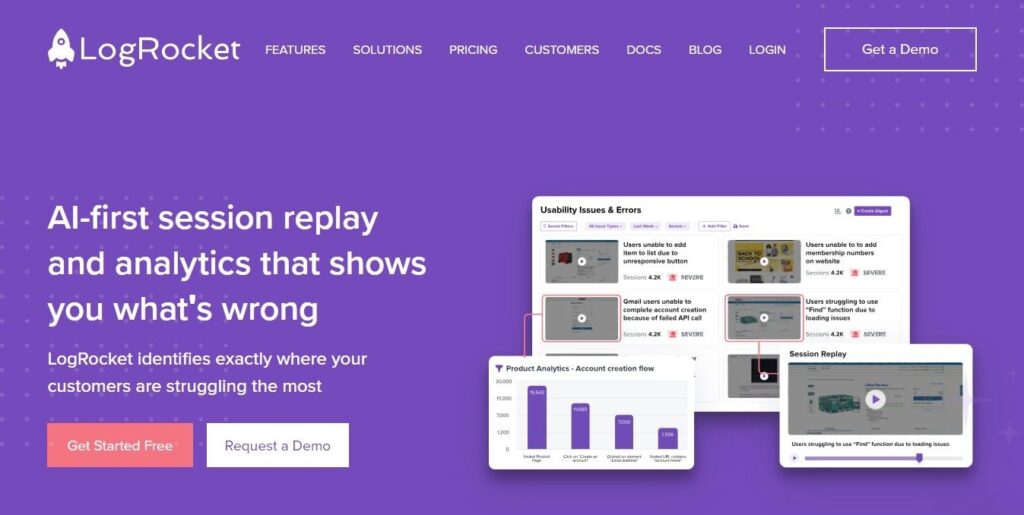
LogRocket is a website heatmap tool that goes beyond web analytics to give you a full understanding of how users are interacting with your website.
By capturing every click, scroll and console log, LogRocket gives you a full replay of user sessions so you can see exactly what users are doing and experiencing.
Unlike tools that only use aggregated data, LogRocket gives you a visual view of user behaviour.
This will help you to see pain points, understand user flows, and optimise your website for better user experience.
With LogRocket, you can get valuable insights into user behaviour, troubleshoot faster, and make data-driven decisions to improve your website.
Features and Integrations:
👉 Session recordings with detailed user interaction data
👉 JavaScript error tracking and reporting
👉 Product analytics for user engagement
👉 Integrations with development and analytics tools
Pros
- Great for debugging and troubleshooting user experience issues
- Gives you insight into user frustration
- Technical performance focus
Cons
- Not suitable for marketing analysis
- Pricing higher than some competitors
Best for:
- Development teams and product managers
- Websites with complex user interactions and technical issues
- Companies that prioritise user experience optimisation
Pricing:
- Free plan available
- From $69 per month
5. Zipy.ai
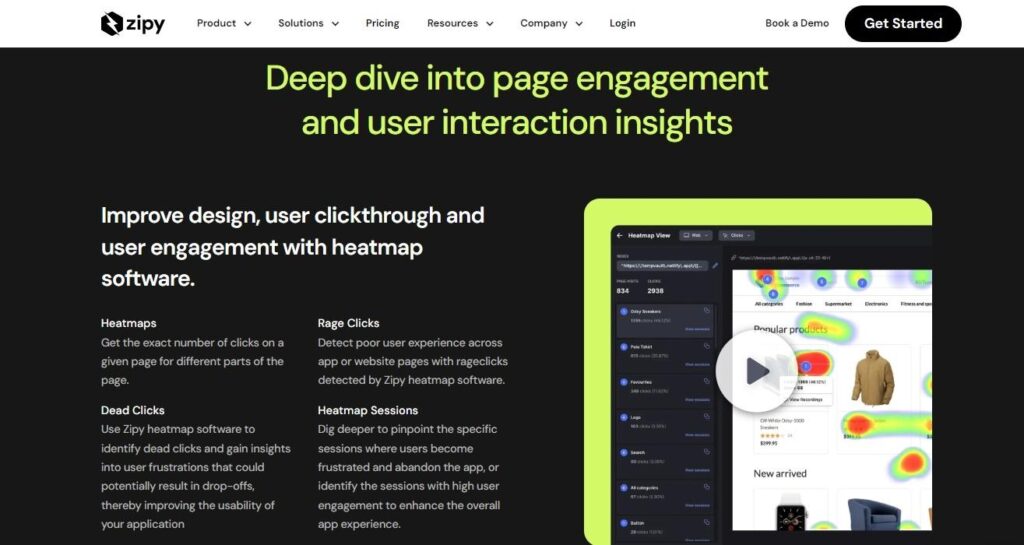
Zipy.ai takes this understanding to a new level with its powerful website heatmap tool capabilities.
Heatmaps visually represent how users interact with your webpages, highlighting areas of high engagement and those that are being overlooked.
This can be super valuable for understanding user preferences, optimising website design and overall user experience.
Features and Integrations:
👉 Heatmaps and session recordings
👉 Basic filtering and segmentation
👉 Website platform integrations
Pros
- Free plan available
- Simple and easy to use
- Good for basic heatmap analysis
Cons
- Limited features compared to paid plans
- Not suitable for advanced analysis
Best for:
- Small business or individual on a budget
- Websites with simple user flows
- Users looking for a simple heatmap solution
Pricing:
- Free plan available
- From $39 per month
6. Smartlook
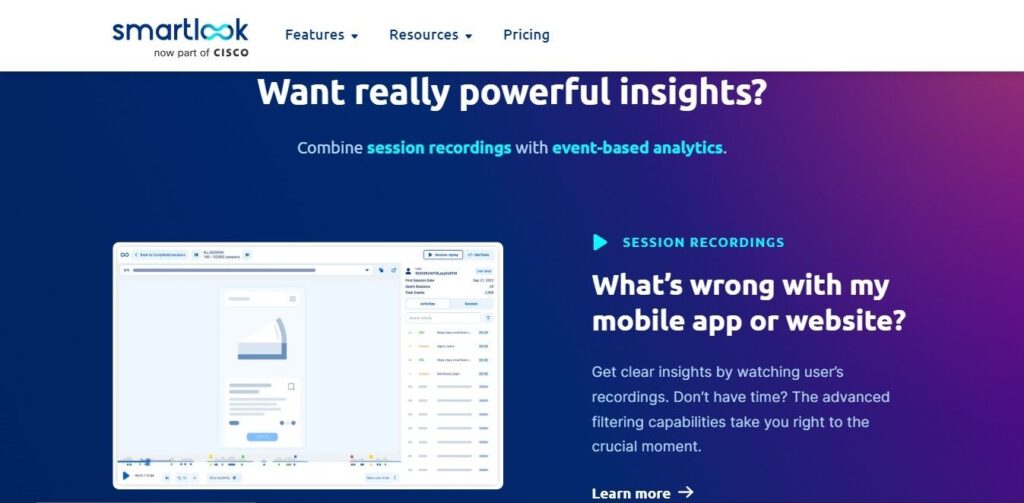
Smartlook is a website heatmap tool that gives you a visual view of how visitors are interacting with your website or app.
Heatmaps, session recordings and event tracking give you valuable insights into user behaviour so you can optimise your website for better user experience and more conversions.
By seeing how users are navigating your website and what they are doing you can see where they are getting stuck or lost.
This will assist you in making data-driven decisions to enhance the operation, content, and appearance of your website.
With Smartlook you can get to know your audience better and tailor your website to them more.
Features and Integrations:
👉 Heatmaps, scroll maps, click maps
👉 Session recordings with filtering and tagging
👉 Conversion funnels and event tracking
👉 Google Analytics, Shopify and more integrations
Pros
- Easy to use
- Strong analytics
- Suitable for many use cases
Cons
- Pricing higher than some competitors78
- Some advanced features require setup
Best for:
- Businesses looking for a full behaviour analytics solution
- E-commerce websites to track conversions and optimise funnels
- Companies that need advanced filtering and segmentation
Pricing:
- Free plan available
- From $55 per month
Paid Heat Mapping Tools
7. Zoho Pagesense
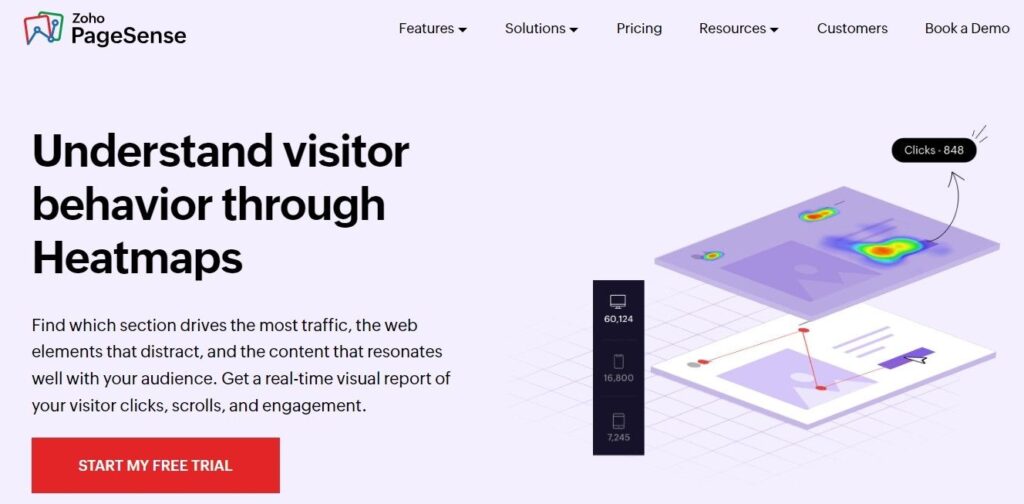
Zoho PageSense is a website heatmap tool that helps you see how visitors are interacting with your website.
By using heatmaps you can get valuable insights into user behaviour, see where to improve and optimise your website for better conversions.
With Zoho PageSense you can see where users are clicking, scrolling and spending most of their time on your website.
This will enable you to identify what is and is not working for your website and make data-driven decisions to enhance its functionality.
Features and Integrations:
👉 Heatmaps, scroll maps, attention maps
👉 Session recordings and funnel analysis
👉 A/B testing and multivariate testing
👉 Zoho CRM, Zoho Campaigns and other Zoho products integrations
Pros
- Easy to use
- Integrates with other Freshworks tools
- Affordable
Cons
- Limited for advanced users
- Fewer integrations than some competitors
Best for:
- Freshworks users
- Businesses that want an all in one marketing and analytics platform
- Companies that value ease of use and cost
Pricing:
- From $14 per month
8. Freshworks

Freshworks has website heatmap tool functionality within its customer engagement platform.
You can track and analyse user behaviour on your website and make data driven decisions to improve user experience and drive conversions.
By seeing how visitors are interacting with your website you can see where to improve, optimise your content and ultimately increase your website’s effectiveness.
Features and Integrations:
👉Heatmaps, scroll maps, click maps
👉Session recordings and funnel analysis
👉A/B testing and personalisation
👉Freshdesk, Freshsales and other Freshworks products integrations
Pros
- Part of a larger customer engagement platform
- Suitable for businesses using other Freshworks tools
- Personalisation and A/B testing
Cons
- Less focused on heatmap analysis than dedicated tools
- Pricing can be high for small businesses
Best for:
- Freshworks users
- Businesses that want a full customer engagement solution
- Companies that want to combine heatmaps with personalisation and A/B testing
Pricing:
- From $19 per month
9. Heatmap.com
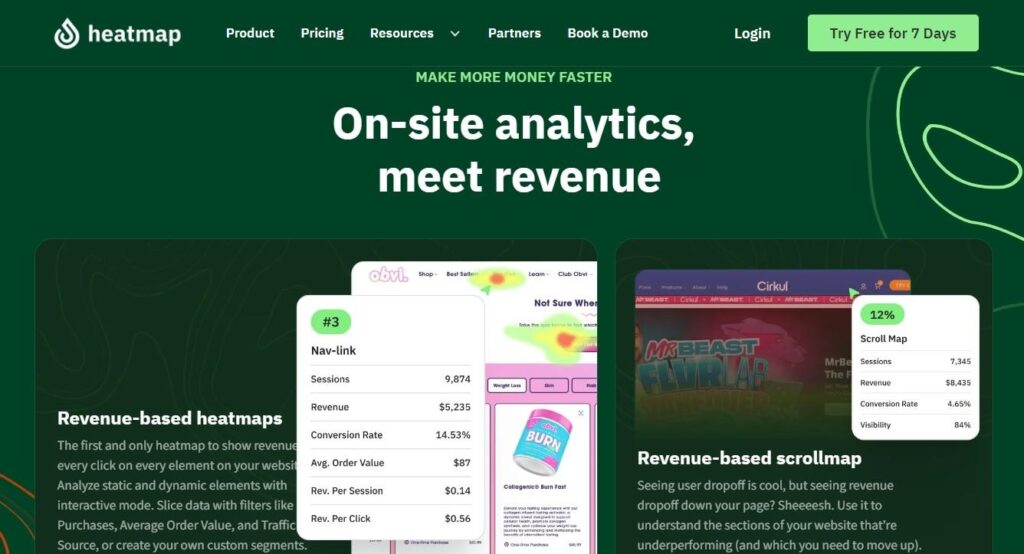
Heatmaps are a visualisation tool that uses colour gradients to represent data density or intensity across a map or image.
In website analytics heatmaps are used to visualise user behaviour and see where the hotspots are on a web page.
By mapping user clicks, scrolls and hovers heatmaps give you a visual representation of where users are focusing their attention.
This will give you valuable insights into how users interact with your website, see where the interest areas are and make data driven decisions to improve user experience and conversions.
Features and Integrations:
👉 Heatmaps, scroll maps, click maps
👉 Session recordings with advanced filtering
👉 Conversion funnels and form analytics
👉 Google Analytics, Adobe Analytics and more integrations
Pros
- Focused on heatmap analysis
- In-depth user interaction insights
- Suitable for websites and mobile apps
Cons
- Less user friendly interface than some competitors
- Pricing can be higher than some alternatives
Best for:
- Businesses that want a dedicated heatmap solution
- Companies with website and mobile app analytics needs
- Users that need advanced filtering and segmentation options
Pricing:
- From $89 per month
Start Free Trial
Highlight real-time activities like reviews, sales & sign-ups.

10. Attention Insight

Attention Insight is a website heatmap tool that goes deeper into heatmapping.
While traditional heatmaps give you an overall view of where users are looking on a page, attention insights drill down into specific areas of interest.
By tracking eye movements and fixation points, attention insights will show you which elements on your website are getting the most attention.
This will give you valuable insights into how users see your content, where they might be distracted, and how to design for maximum engagement.
With attention insights, you can get a more detailed understanding of user behaviour and make informed decisions to improve your website.
Features and Integrations:
👉 AI powered attention heatmaps
👉 Session recordings and click maps
👉 Conversion funnels and A/B testing
👉 Google Analytics and content management system integrations
Pros
- New way of visualising user attention
- Goes beyond traditional heatmaps
- For visual content and layout optimisation
Cons
- AI predictions not always 100% accurate
- Pricing can be higher
Best for:
- Businesses with visual content and design focus
- Companies that want the latest in heatmap analysis
- Users willing to pay for AI powered insights
Pricing:
- From $31 per month
11. Contentsquare

Contentsquare is a digital experience platform that offers a range of tools to help businesses understand and optimise their websites.
As a website heatmap tool, it provides visual representations of user interactions, making it easier for marketers and UX experts to analyze user behavior.
One of its features is heat mapping.
Heatmaps are a visual representation of user activity on a website. They use colour gradients to show where users are clicking, scrolling and hovering.
This will show you at a glance which areas of your website are getting the most attention and which are being ignored.
By looking at heatmaps you can see where users are struggling, where to improve and make data driven decisions to improve your website’s user experience and conversion rates.
Features and Integrations:
👉 Heatmaps, scroll maps, zone based heatmaps
👉 Session replays and customer journey analysis
👉 Content performance and merchandising analytics
👉 Adobe Analytics, Salesforce and more integrations
Pros
- Digital experience analytics platform
- Advanced heatmap and user behaviour analysis
- For large enterprises with complex analytics needs
Cons
- Pricing is usually high and geared towards enterprise
- Can be overwhelming for small businesses
Best for:
- Large enterprises looking for a robust analytics solution
- Companies with big data analysis and optimisation needs
- Users that want advanced features and integrations
Pricing:
- Custom pricing for you
Email Heat Map Tools
12. EmailHeatmaps.com
EmailHeatmaps.com is a website heatmap tool that shows you a new way to see how your recipients interact with your emails.
By tracking clicks, scrolls and other user behaviour, email heatmaps give you valuable insights into email engagement and performance.
By seeing where users are clicking, scrolling and spending most of their time, you can identify areas of interest, optimise your email design and improve your overall email marketing strategy.
Features and Integrations:
👉 Heatmaps for email clicks and opens
👉 Device and email client reporting
👉 A/B testing for email subject lines and content
👉 Integrations with email marketing platforms
Pros
- Email focused analytics
- Email engagement and performance insights
- Optimize email campaigns for better results
Cons
- Only email heatmap analysis
- Not for broader website analytics
Best for:
- Businesses that are email marketing heavy
- Companies looking to improve email open and click through rates
- Users looking for a dedicated email analytics solution
Pricing:
- From $11 per month
Start Free Trial
Highlight real-time activities like reviews, sales & sign-ups.

Choosing the Right Heatmap Software
Choosing the right heatmap tool can be tough but considering these factors can make it easier.
➥ Your Specific Needs
What are the key features you need?
Do you need basic heatmaps or advanced analytics?
Do you need session replays or funnel analysis for your goals?
➥ Ease of Use
Choose a tool with a simple interface that you and your team can use. A complicated tool can stop you from getting insights fast.
➥ Integration with Your Existing Tools
Make sure the tool integrates with your current analytics and marketing platforms. This will make data collection and analysis easier.
➥ Pricing
Compare the pricing plans of different tools and choose one that fits your budget. Consider the value you’ll get from the tool’s features and insights.
➥ User Reviews
Read reviews from other users to get an idea of their experience with the tool. Look for feedback on ease of use, customer support and overall value.
Comparison of Heatmap Software Specs and Plans
When comparing heatmap software specs and plans, consider the following factors:
Core software functionality: Look for features like click tracking, scroll maps, and user session recording.
User interactions: Consider the types of user interactions that the software can track, such as clicks, scrolls, and mouse movements.
Users interact: Think about how users interact with your website or app and what types of insights you need to gain.
User sessions: Consider the length and complexity of user sessions and how the software can help you analyze them.
Heatmap software: Think about the types of heatmaps that the software can generate and how they can help you optimize your website or app.
Web analytics tool: Consider whether the software integrates with other web analytics tools, such as Google Analytics.
Google Tag Manager: Consider whether the software integrates with Google Tag Manager and how it can help you manage your website’s tags and tracking codes.
Start Free Trial
Highlight real-time activities like reviews, sales & sign-ups.
Getting Started with Heatmapping
Step 1: Define your Goals
The first and most important step in any successful heatmapping project is to define your goals.
What do you want to achieve with heatmapping? Do you want to improve user engagement, boost conversions or identify areas of pain in the user journey?
Your heatmap analysis will be guided by your clearly defined objectives, ensuring that you obtain the most pertinent and useful information.
if your main goal is to improve user engagement you might focus your heatmaps on areas of high interaction such as popular content sections or frequently clicked CTAs.
Step 2: Choose the Right Heatmap Tool
Heatmap tools have become a must have for businesses and website owners to understand how users interact with their website.
They show user behavior by where visitors click, scroll, hover and focus their attention.
Choosing the right heatmap tool can make a big difference in improving user experience, driving conversions and optimising site performance.
This guide will help you understand the key factors to consider when choosing the right heatmap tool for your website.
Step 3: Install the Heatmap Tracking Code
First get the heatmap tracking code from your chosen heatmap software provider.
This code is unique to your account and website. Paste this code into the <head> section of every page on your website you want to track.
If you use a content management system (CMS) there might be a plugin or integration available to make this easier.
Step 4: Configure the Heatmap Settings
Heatmapping is a visualisation technique that shows how users interact with your website or application.
By tracking mouse movements, clicks and scrolling behaviour you can create heatmaps that show areas of high engagement and pain points.
Step 5: Start Collecting Data
Heatmapping is a visualisation tool to show how users interact with your website or application.
By collecting and analysing data on user behaviour you can get valuable insights on where users are clicking, scrolling and spending their time.
This can be used to improve the design and usability of your website and get more engagement and conversions.
First step to create a heatmap is to start collecting data on user interactions.
This can be done using various tools and techniques such as heatmap tracking software, eye-tracking studies and user surveys.
Step 6: Analyse the Heatmap Data
Identify Hotspots: Look for areas of high intensity (often shown in warmer colours) to see areas of high user activity or interest.
Recognise Coldspots: Look for areas of low intensity (often shown in cooler colours) to see areas of low user engagement.
Look for Patterns: Look for trends or patterns in the data to see user behaviour or preferences.
Track Changes Over Time: Compare heatmaps from different time periods to see changes in user activity or engagement over time.
Correlate with Other Data: Combine heatmap data with other data sources (e.g. website analytics) to get more insight into user behaviour.
Step 7: Draw Actionable Insights
◈ Look for areas of high click or hover density. This could be where users are finding valuable content or interacting with elements successfully.
◈ Areas of low interaction could be points of friction, confusion or lack of interest. Consider redesigning or rethinking these areas.
◈ A cluster of clicks on a non-interactive element could be user frustration. This could be because the element looks clickable or there is an issue with the functionality.
◈ Look at how far users scroll to see content engagement. If users aren’t scrolling to key sections consider moving important content higher up the page.
◈ When a page appears to end but has more content below the fold users might not scroll further. Make sure key elements are visible without too much scrolling.
Step 8: Implement and Iterate
This is where your heatmap insights become reality. Implement changes to your website or app based on your findings. This might include:
- Redesigning underperforming elements
- Moving important CTAs
- Simplifying navigation
- Simplifying forms
- Improving content layout
Step 9: Review Heatmaps Regularly
Make heatmap analysis a part of your website optimisation routine.
Patterns and user behaviour can change over time so it’s important to stay on top of these changes.
Reviewing heatmaps regularly helps you keep your finger on the pulse of your website’s performance and make informed decisions about design, content placement and CTAs.
Step 10: Stay Up-to-Date
Use Dynamic Heatmaps: Static heatmaps give you a snapshot of user interactions.
But dynamic heatmaps give you a real-time view of how users are interacting with your site.
This way you can see emerging trends and potential issues as they happen.
Use AI-Powered Insights: AI-driven heatmapping tools can go beyond basic click and scroll data.
They can analyse user behaviour patterns, predict user intent and even provide personalised recommendations to improve your site’s user experience.
Integrate with Other Tools: Heatmaps shouldn’t exist in a vacuum.
Stay Up-to-Date with New Tech: The world of heatmapping is always changing.
Mistakes to avoid
✖ While heatmaps are useful, don’t rely solely on them. Combine heatmap data with other analytics and user feedback to get the full picture of user behaviour.
✖ Consider the context of user interactions when looking at heatmaps. A high click rate on an element might not always be good if it leads to user frustration or confusion.
✖ Segment your heatmap data by user groups, traffic sources or other relevant criteria to get more targeted insights.
✖ Heatmaps are only useful if you act on the insights. Use the data to make decisions about website design, content placement and conversion optimisation.
Conclusion
Heatmap tools are a must have for understanding how users interact with your website.
By visualising user behaviour you can discover hidden patterns, find areas to improve and make data driven decisions to optimise your website for better results.
Whether you’re just starting out or looking to upgrade your toolkit the 12 heatmap tools in this guide have got you covered for all budgets.
Remember, the key is to choose the right tool, implement it well and review and act on the insights it gives you.
Boost Conversion Instantly
Add Social Proof & Urgency to your website