
31 Impactful Push Notification Statistics (New data)
Push notification opt-in rates on Android and iPhone have nearly converged in 2026. Android’s median fell to 59.5% after Android 13 made permission mandatory, iOS held near 49%, and the median app gets about 3 in every 100 notifications opened.
The rest of the picture is about targeting. Triggered pushes get opened at more than three times the rate of generic blasts, and operating systems now quietly drop more of the generic ones.
This page covers push notification opt-in rates by platform and industry, open and click rates, what lifts engagement, send volume, and web push. Every number comes from a 2025 or 2026 benchmark report.
Key takeaways
- Android no longer hands you reach by default. Its median opt-in dropped almost 12 points in one year.
- A median direct open rate of about 3% is normal. The top tenth of apps reach 8% to 11%.
- Behavior-triggered pushes beat broadcasts on opens, delivery, and unsubscribes.
- The market is splitting into heavy senders and careful senders, with fewer apps in between.
What are the key push notification statistics?
The key push notification statistics for 2026 show app opt-in near 61%, median open rates near 3%, and triggered pushes opening three times more often.
| Metric | Latest figure | Data year |
|---|---|---|
| Median Android opt-in rate | 59.5% | 2024 |
| Median iOS opt-in rate | 49.4% | 2024 |
| Average app opt-in, both platforms | 61% | 2025 |
| Median direct open rate, Android / iOS | 3.4% / 3.1% | 2024 |
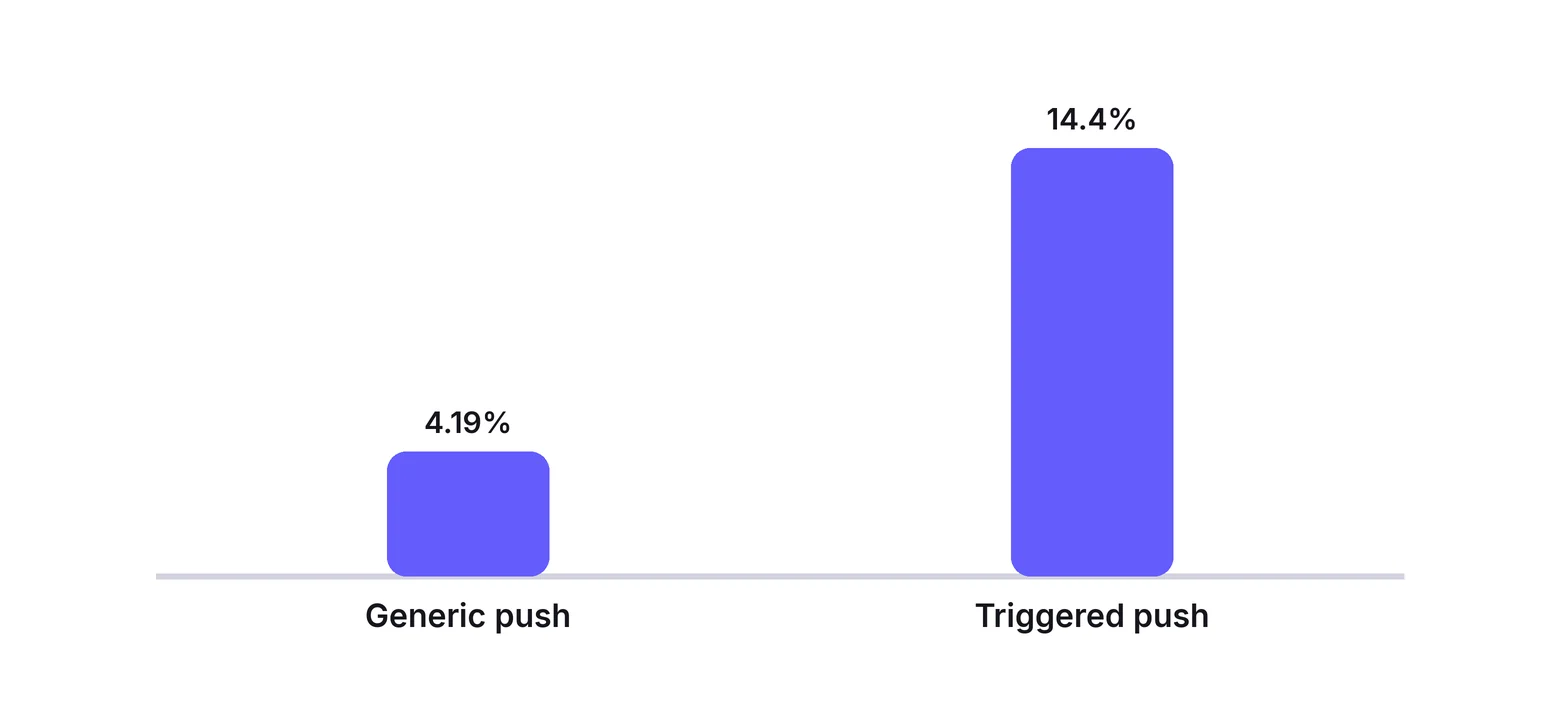
| Open rate, triggered vs generic push | 14.4% vs 4.19% | 2025 |
| Ecommerce push click rate, Android / iOS | 3.78% / 3.05% | 2025 |
| Delivery rate, broadcast vs behavior-triggered | 80.73% vs 93.07% | 2024-2025 |
| Web push traffic from mobile devices | 72.8% | 2025 |
What is a push notification?
A push notification is a short message that an app or website sends to a device’s lock screen or notification center, even while closed.
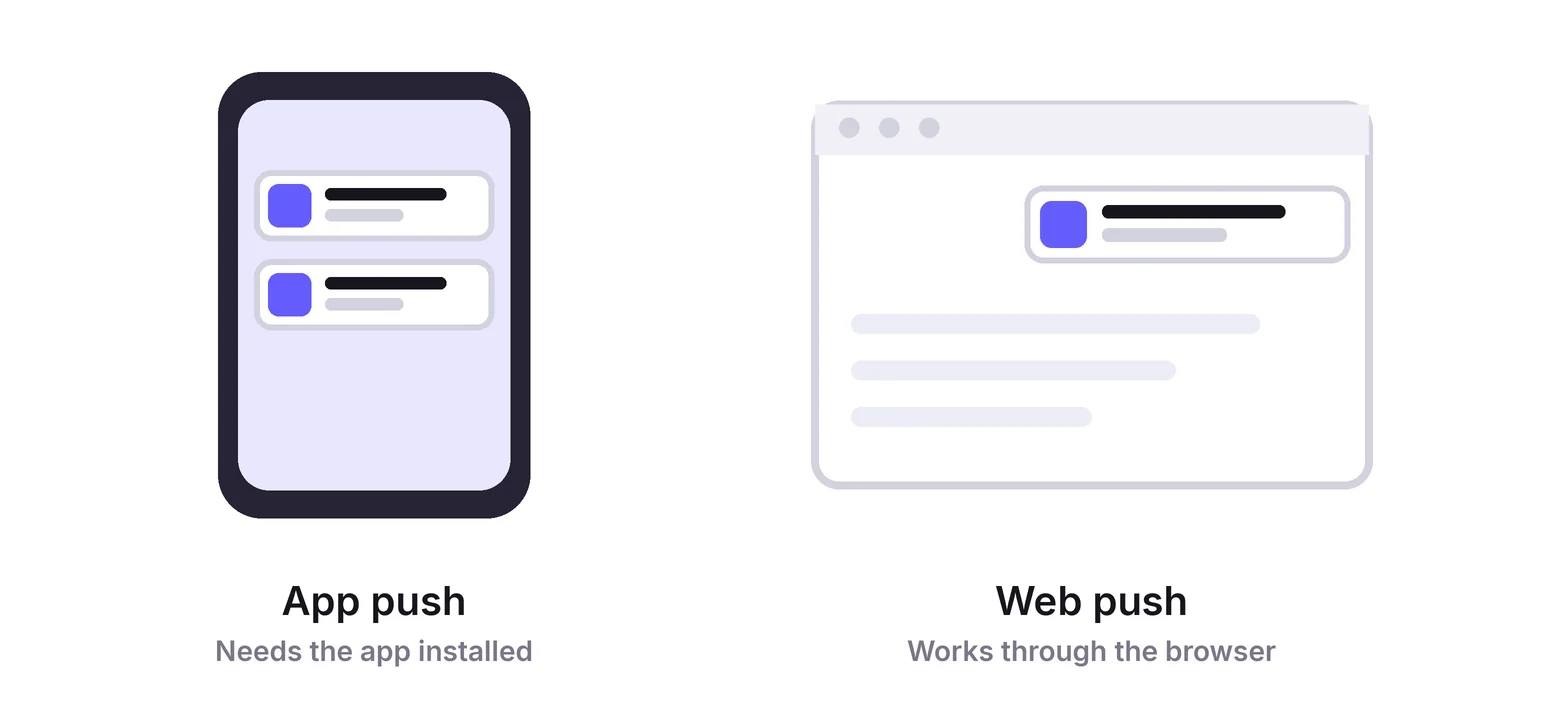
App push needs the app installed and permission granted on the phone. Web push works through the browser, where a visitor clicks allow once and the site can reach that visitor after the tab closes.
Most of the numbers below are app push. Web push has its own section near the end, because its opt-in behavior is different.
What is the average push opt-in rate?
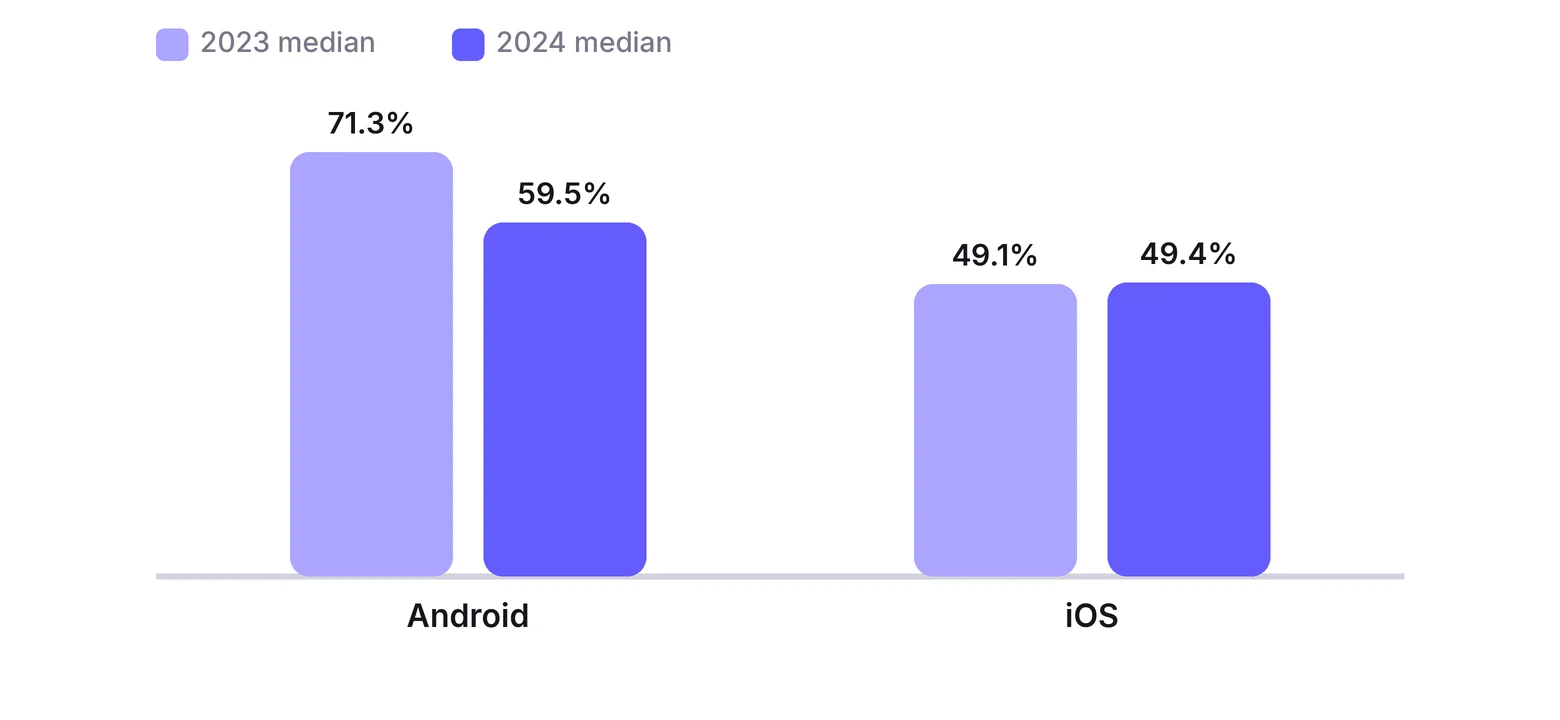
The average push notification opt-in rate is about 61%, with the median Android app at 59.5% and the median iOS app at 49.4%.
Opt-in rates by platform
1. The median Android opt-in rate fell from 71.3% in 2023 to 59.5% in 2024.
2. The median iOS opt-in rate barely moved, from 49.1% to 49.4% over the same year.
3. The top tenth of apps reached 79.7% on Android and 74.1% on iOS in 2024.
4. The bottom tenth sat at 37.1% on Android and 27.1% on iOS.
5. A second benchmark found a steeper drop, with Android opt-in falling from 85% to 67% in one year and iOS slipping from 58% to 56%, for an overall average of 61%.
6. The largest 2026 benchmark, built on 681 billion notifications to more than 3 billion users, puts Android and iOS opt-in at near parity.
Many stats pages still quote 81% on Android and 51% on iOS. Those figures come from 2021, before Android 13 made the permission prompt mandatory.
Opt-in rates by industry
7. By industry, ecommerce and retail apps average 52.78% opt-in on iOS and 75.27% on Android.
8. Hypercasual games have the lowest iOS opt-in at 23.01%, while insurance apps reach 91.63% on Android.
9. Rewards and loyalty is the only industry where iOS opt-in (62.14%) beats Android (55.03%).
| Industry | iOS opt-in | Android opt-in | Caveat |
|---|---|---|---|
| Ecommerce and retail | 52.78% | 75.27% | A 22-point platform gap |
| Banking | 74.62% | 75.79% | Almost no gap between platforms |
| Health and fitness | 53.98% | 85.28% | Android users far more willing |
| Travel and transportation | 60.48% | 84.75% | Trip alerts give a clear reason to allow |
| Streaming | 39.58% | 64.88% | Among the lowest on iOS |
| Rewards and loyalty | 62.14% | 55.03% | The only industry where iOS leads |
Industry figures come from one vendor’s customer base, so treat them as ranges to aim for, not exact targets.
What raises opt-in
10. Apps that run onboarding campaigns see opt-in rates as much as 40% above their category average.
11. In-app messages raise opt-in among users who first declined by 14% on average.
Earn the opt-in during onboarding, not at first launch.
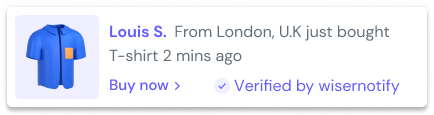
Build trust & FOMO
Highlight real-time activities like reviews, sales & sign-ups.


What is the average push open rate?
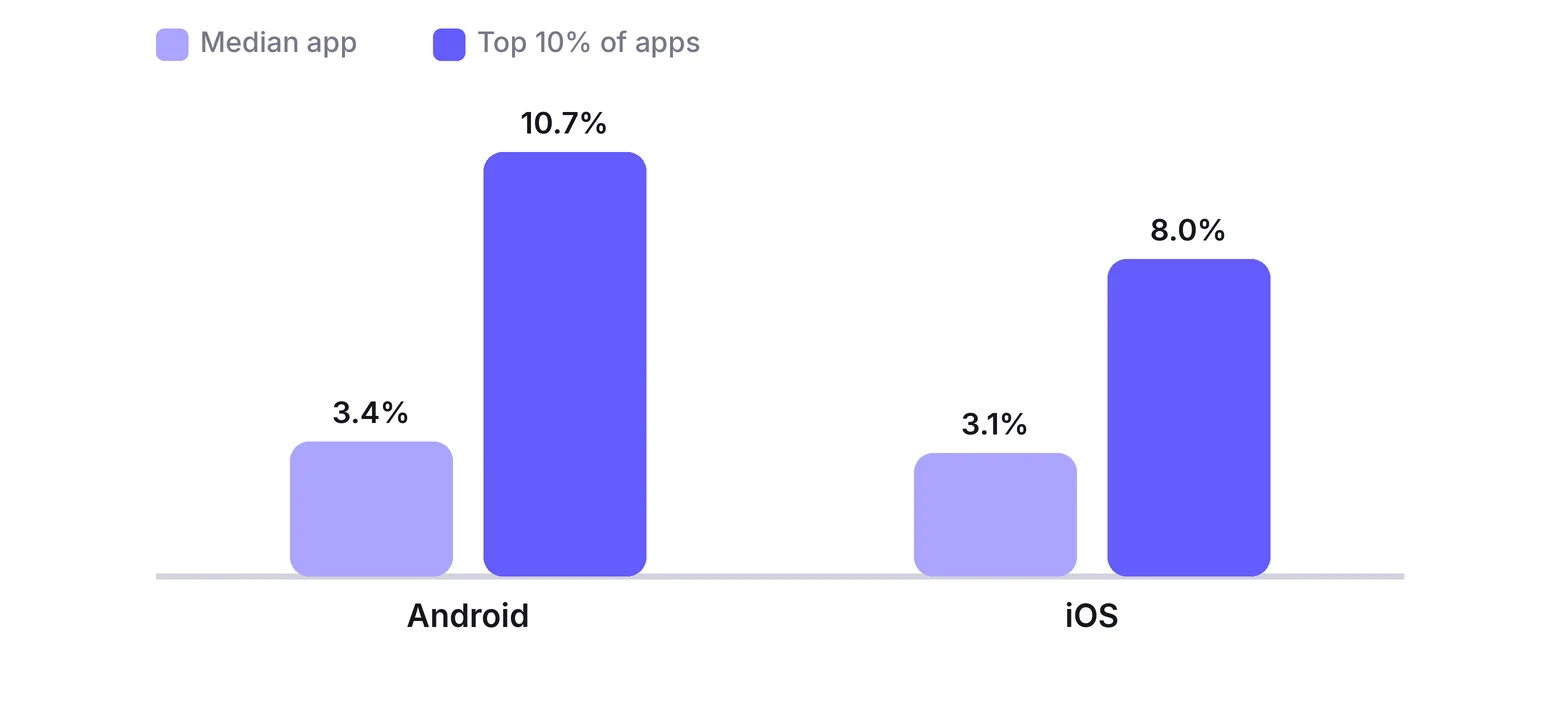
The median push notification direct open rate is 3.4% on Android and 3.1% on iOS, while the top tenth of apps reach 8% to 11%.
Median apps vs top apps
The direct open rate is the share of notifications tapped to open the app. Click rate, used in some reports, is close in meaning but not identical.
12. The median direct open rate was 3.4% on Android and 3.1% on iOS in 2024, unchanged from the year before.
13. The top tenth of apps reached 10.7% on Android and 8.0% on iOS, with the iOS figure down from 8.6%.
Triggered vs generic campaigns
14. Triggered pushes, sent after a user action or at a set time, averaged a 14.4% open rate. Generic campaigns averaged 4.19%.
15. Banking and finance apps led generic campaigns at 8.8% on Android and 7.2% on iOS.
16. Mobility apps led triggered campaigns at 18.5% on Android and 23.4% on iOS.
17. Ecommerce and retail apps average a 3.78% click rate on Android and 3.05% on iOS, above the all-industry average on both.
A 3% median sounds low until you compare it with the top tenth. The gap between an average app and a strong one is roughly three times the opens from the same audience.
What makes push notifications perform better?
Push notifications perform better when behavior triggers them, audience segments shape them, and rich media carries them, which lifts opens, purchases, and delivery.
18. Segmented pushes lift direct open rates by 18% to 65%, and by as much as 334%.
19. The same segmentation lifts purchases attributed to push by 4% to 72%, and by as much as 350%.
20. Rich push with images lifts direct open rates by 22% on average over plain text.
21. Across channels, personalized messages showed a 37.6x conversion lift in 2026, up from 2.4x in 2024.
22. Nearly half of 651 B2C marketers surveyed still use personalization tactics designed for 2022.
If you want the wider personalization data, our ecommerce personalization stats cover email, on-site, and product recommendations too.
Build trust & FOMO
Highlight real-time activities like reviews, sales & sign-ups.

How many notifications is too many?
No benchmark sets a safe number of push notifications, but generic broadcasts get delivered less often and drive far more unsubscribes than triggered messages.
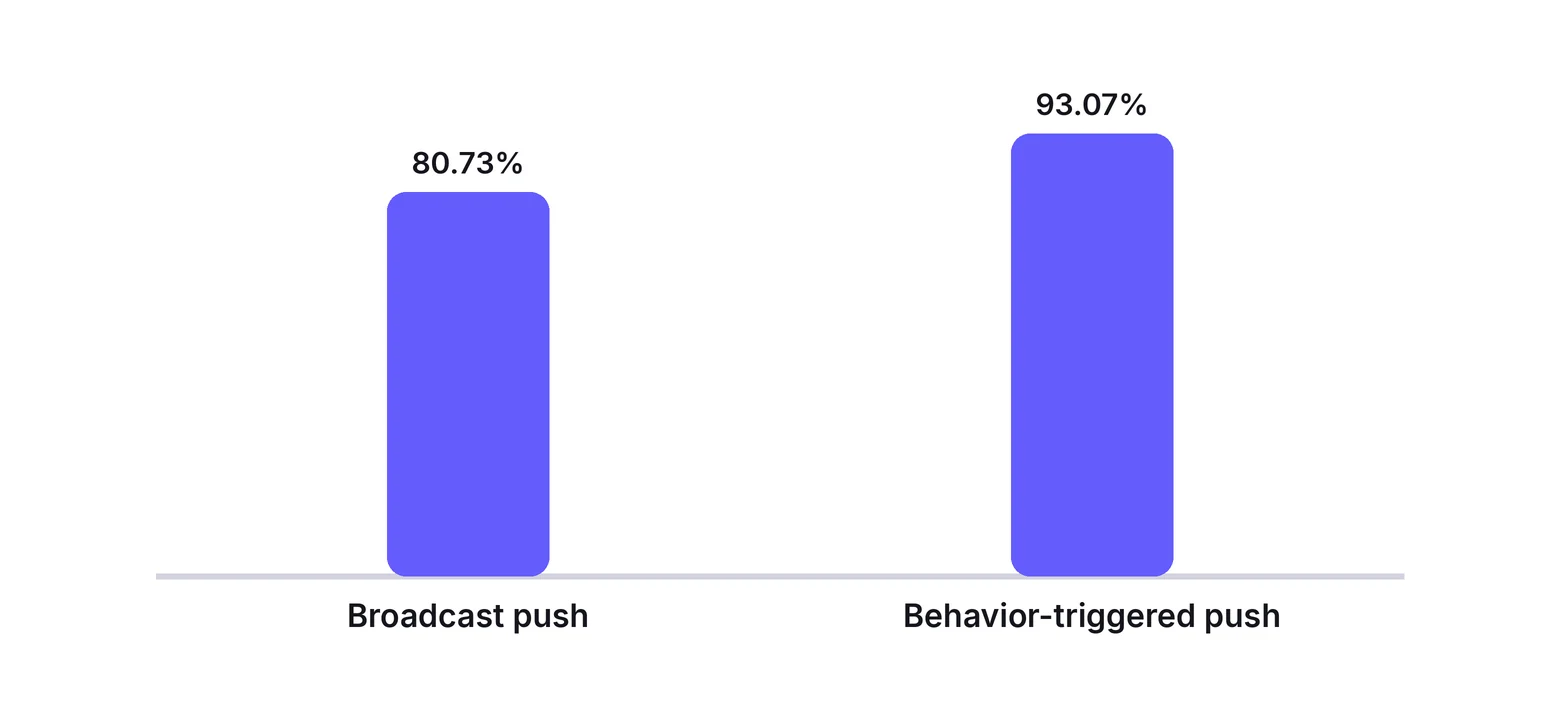
23. Broadcast pushes reached an 80.73% delivery rate, against 93.07% for behavior-triggered pushes.
24. Non-personalized messages can drive unsubscribe rates up to 25 times higher than journey-based ones.
25. The apps that already send the most notifications, the top tenth, raised their monthly volume again in 2025.
26. Meanwhile, Android’s median and low-volume senders cut their volume by 15% year over year.
27. In food and drink apps, the gap between the top and bottom tenth reached 57.32 percentage points on Android and 49.63 on iOS.
You will see “46 notifications a day” quoted on many stats pages. We could not trace it to a current primary source, so it is not in this list.
A triggered push is the cheapest volume you can add. Cart reminders are the classic case. Our guide to cart abandonment covers what to send and when.
How does web push perform?
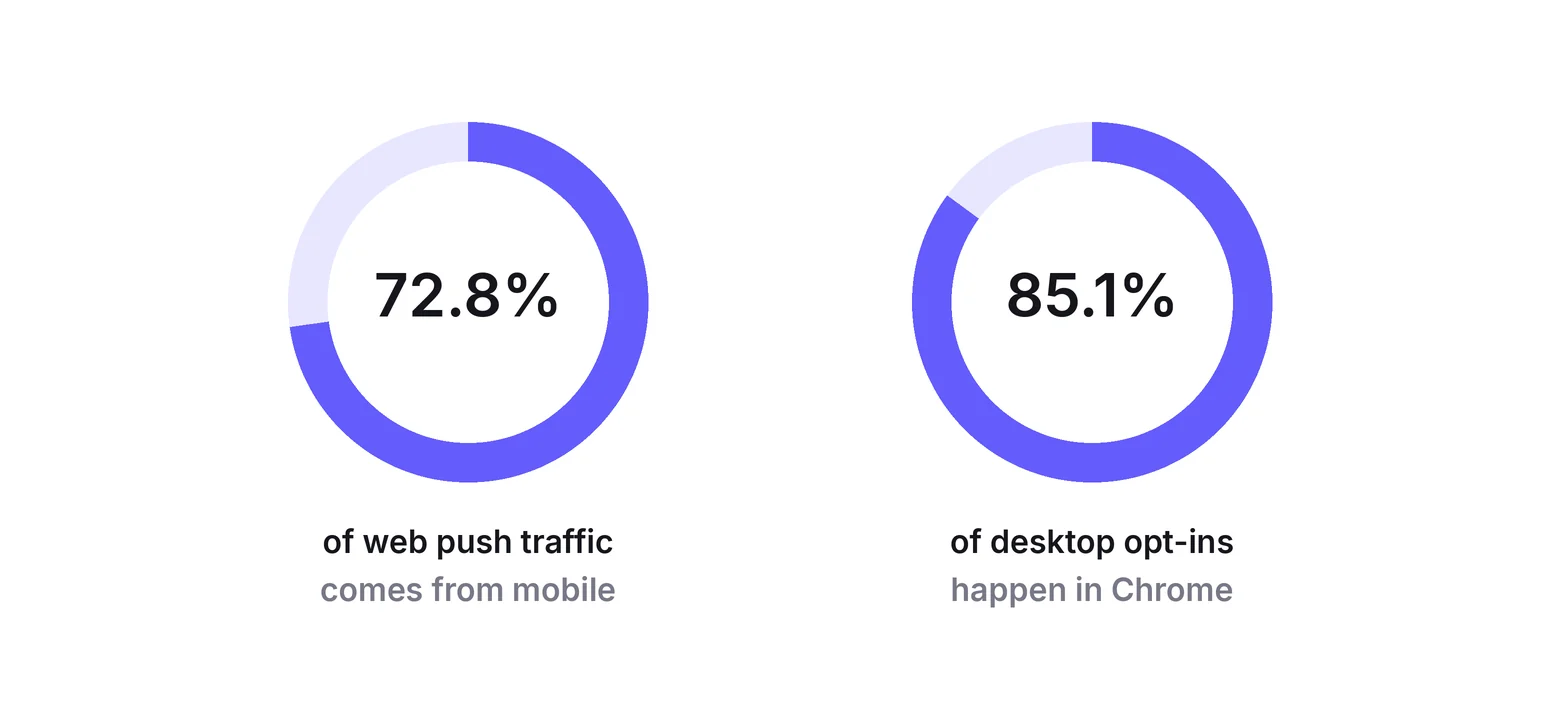
Web push notifications reach most subscribers on mobile browsers, with 72.8% of web push traffic coming from mobile and 85.1% of desktop opt-ins in Chrome.
Web push needs no app install and no email address, so it behaves differently from app push.
28. 72.8% of web push traffic comes from mobile devices.
29. On desktop, 85.1% of people who opt in to web push use Google Chrome.
30. The services industry has the highest web push opt-in rate, at 86.1%.
31. iPhones and iPads have supported web push since iOS 16.4, but only for sites the user adds to the Home Screen.
That last point matters for stores. On iPhone, a visitor who never saves your site cannot get your web push, so on-site messages carry more of the load there.
Web push brings people back. What they see when they land decides whether they buy, which is where FOMO marketing and live social proof do their work.
Build trust & FOMO
Highlight real-time activities like reviews, sales & sign-ups.

How is push changing in 2026?
Push notifications in 2026 require permission on both Android and iOS, face stronger on-device filtering, and reward triggered messages over scheduled broadcasts.
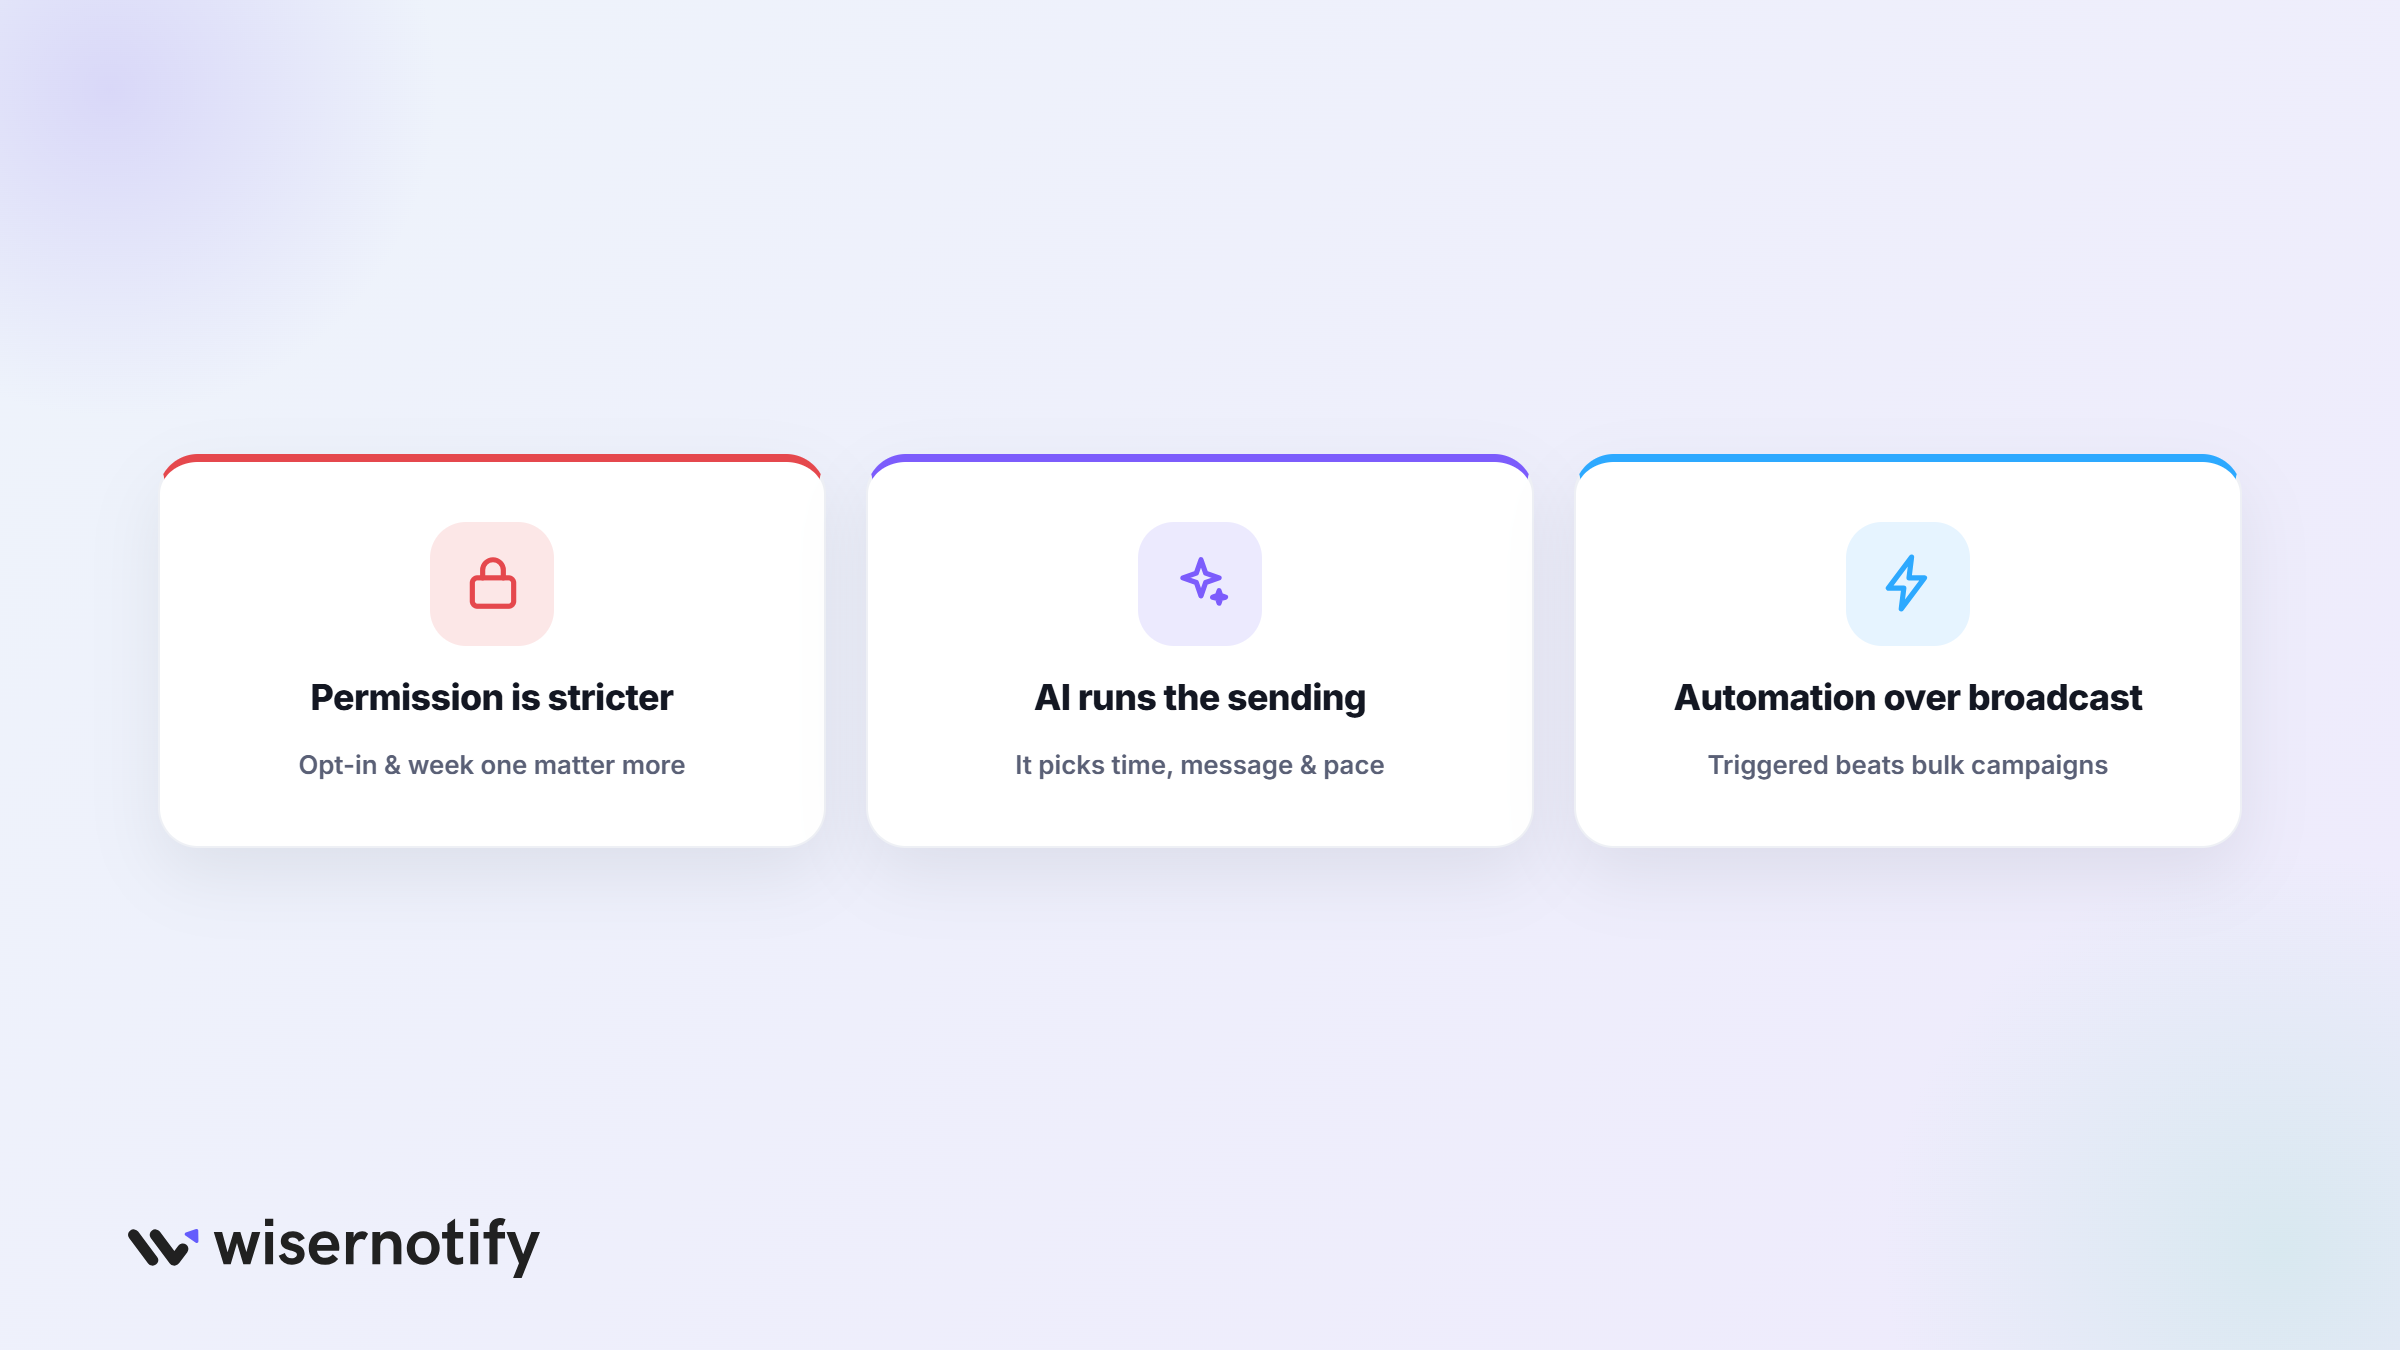
Permission is stricter everywhere. With Android 13 and later now standard, the default opt-in is gone, and the first prompt carries more weight than it used to.
The phone is filtering more. Apple Intelligence now summarizes notifications on iPhone, and irrelevant messages risk being pushed down by those summaries.
Automation beats broadcasting. Triggered pushes win on opens, delivery, and unsubscribes in every report above, so the channel keeps moving from announcements to reminders tied to what a person did.
Retention is where that pays off. Our customer retention analytics guide shows how to measure the return visits push brings back.
Build trust & FOMO
Highlight real-time activities like reviews, sales & sign-ups.
Wrap Up
Push still works, but it no longer comes free. Both platforms now make you ask, and the median app reaches only half its users.
The apps doing well send fewer generic blasts and more messages tied to what someone just did. They earn the opt-in during onboarding, and they treat every notification as something the person should be glad to get.
For the social proof side of the same funnel, see our social proof statistics.
Sources
Airship 2025 report | Airship 2026 report | Batch benchmark | Pushwoosh opt-in data | Pushwoosh CTR data | MoEngage 2026 benchmarks | WebKit web push
Frequently Asked Questions
What is a good push notification opt-in rate?
About 60% on Android and 49% on iOS is the median in the latest benchmark. The top tenth of apps reach 74% to 80%.
How often do people open push notifications?
Push notifications get tapped open about 3% of the time for the median app. Strong apps reach 8% to 11%.
Why did Android push opt-in rates drop?
Android 13 made apps ask for notification permission the way iOS always has, so Android no longer opts people in by default.
Do triggered push notifications perform better?
Yes. Pushes sent after a user action open at more than three times the rate of generic campaigns.
How many push notifications does a person get per day?
No current primary source puts a reliable number on it. The widely quoted 46 a day could not be traced to a recent study.
Is web push different from app push?
Web push needs no app, only a browser and one click on allow. App push needs an installed app and permission on the phone.
Does iPhone support web push notifications?
Yes, since iOS 16.4, but only for sites the person has added to the Home Screen.

Krunal Vaghasiya is a marketing tech expert who boosts e-commerce conversion rates with automated social proof and FOMO strategies. He loves to keep posting insightful posts on online marketing software, marketing automations, and improving conversion rates.




 Capterra