

Running an ecommerce store? Then you’re sitting on a goldmine of data, if you know how to use it.
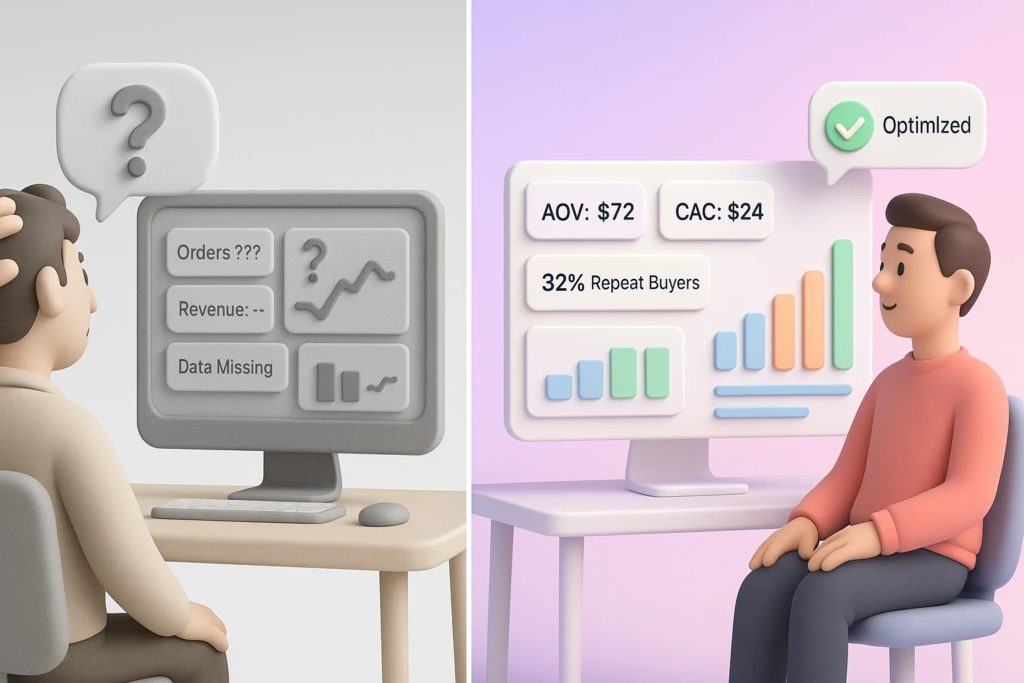
Most online businesses don’t have a data problem.
They have a reporting problem. Metrics exist, but they’re scattered across tools, dashboards, and tabs.
This guide walks you through the essential ecommerce metrics, reports, and tools that matter.
The goal? It helps you stop guessing and start making moves backed by real insights.
No fluff. Just clear reporting practices that lead to more innovative marketing, stronger operations, and more sales.
Boost Conversion Instantly
Add Social Proof & Urgency to your website
What Are eCommerce Reports, and Why Do They Matter?
Ecommerce reports are more than just charts.
They answer business questions about revenue, product performance, traffic sources, and customer behavior.
They help you:
Spot what’s working (and what isn’t)
Track metrics like customer acquisition cost (CAC), average order value (AOV), and repeat customers..
Understand the entire customer journey
Uncover growth opportunities across marketing channels
Without ecommerce reporting software or a clear ecommerce dashboard, you’re guessing.
And that’s risky when your store is operating across multiple sales channels.
Core KPIs & Metrics
Let’s get into the ecommerce KPIs that matter most.
1. Sales Performance

Here’s where we track key sales metrics for any ecommerce site, including total revenue, number of transactions, and average order value.
These sales metrics are the lifeblood of any ecommerce site.
Total Sales: Tells you how much revenue you’ve made.
AOV: Helps you understand how much each customer typically spends.
Transactions: Useful for spotting dips or spikes day-to-day.
Dig deeper:
Sales by Product: Find your top performers.
Funnels: Where are customers dropping off?
Seasonal Trends: Useful for planning promotions and inventory.
How WiserNotify Helps Drive Sales
This is where real-time tools like WiserNotify fit naturally into your ecommerce reporting stack.
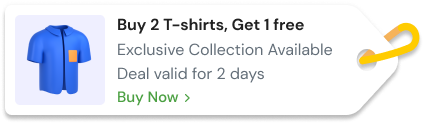
They go beyond basic notifications and popups, offering social proof notifications and FOMO widgets like countdown timers, low-stock alerts, and limited-time deals that speak directly to buyer psychology.
These micro-elements help you build two things that move the sales needle: trust and urgency.


For trust, recent purchases, reviews, and sign-ups show others are engaging with your store. For urgency, countdowns and stock alerts subtly push visitors to take action without pressure.
Analyzing conversion data in your reports helps you identify which notifications or widgets are most effective at driving sales and engagement.
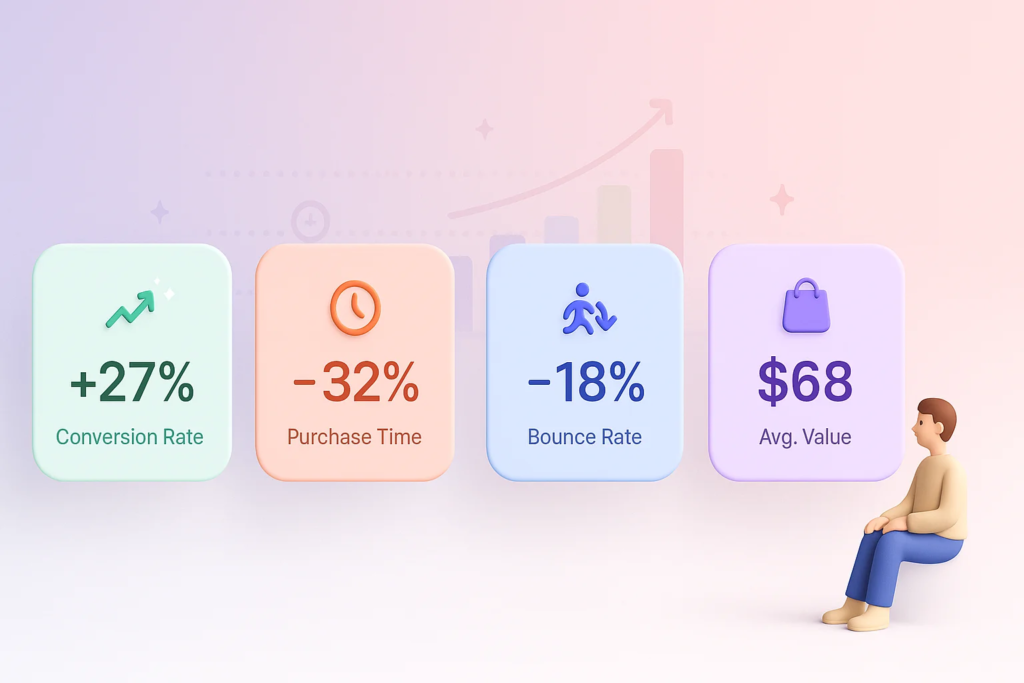
Let’s say you add a low-stock alert to your product page. In your ecommerce reports, you’ll start noticing:
- Higher conversion rates on those pages
- Shorter time-to-purchase for urgency-driven items
- More transactions during campaigns with countdowns
This behavioral data isn’t theory; it’s reflected in metrics like average order value, funnel progression, and bounce rate improvement.
And because it’s automated, you don’t have to create urgency every time manually.
Just set the conditions, monitor results in your ecommerce dashboard, and let the data confirm your visitors’ responses.
It’s one of the easiest ways to convert undecided visitors into paying customers without changing your traffic or running extra ads. Tracking visitors’ progress through the funnel can reveal which elements are most effective at driving conversions at each stage.
Build trust & FOMO
Highlight real-time activities like reviews, sales & sign-ups.


2. Marketing & Acquisition
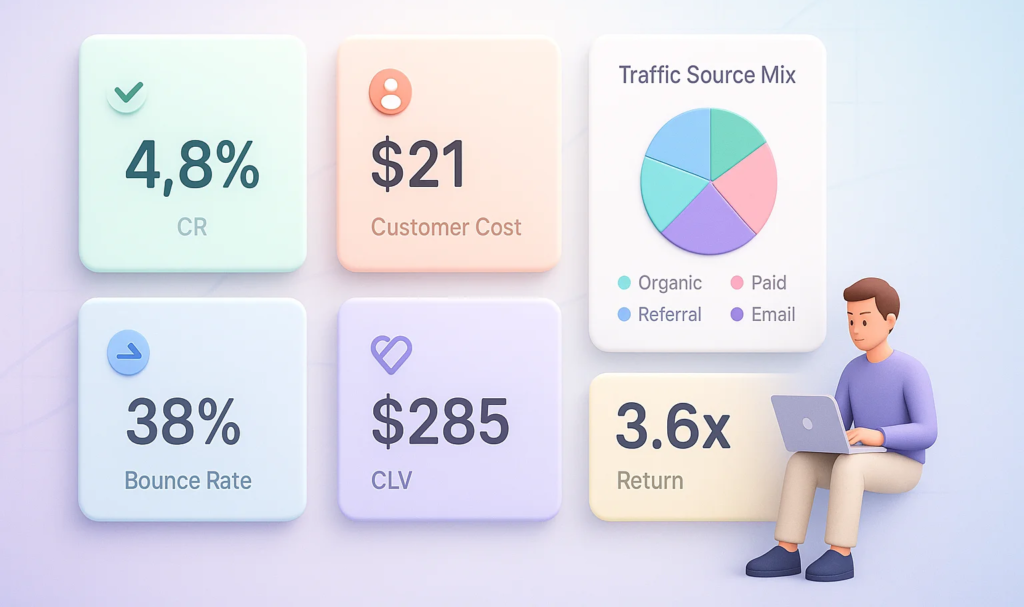
You can’t grow your ecommerce store without knowing where your traffic and new customers are coming from.
Conversion Rate: Are your visitors buying?
CAC: How much does it cost to get one paying customer?
Traffic Sources: Organic? Paid? Referral?
Bounce Rate: Tells you if your site or content is pushing people away.
Also measure:
Customer Lifetime Value (CLV): Tells you what a customer is worth over time.
ROI: Shows if your marketing efforts are worth it.
Track the performance of different email opt-ins to optimize your marketing funnels and increase customer acquisition.
Marketing report templates in tools like Google Data Studio or GA4 can make this easy.
3. Customer Behavior & Retention

Let’s move past vanity metrics.
Look at:
Shopping Cart Abandonment: Why are users not completing the purchase?
Repeat Purchase Rate: How well does your store retain customers?
Net Promoter Score (NPS): Would they recommend you?
Use behavioral analytics to spot patterns:
Who’s leaving without buying?
Which segment buys more often?
Break this data down by:
Device type
Referral source
First vs. returning users
With this info, you can improve both UX and your ecommerce marketing.
4. Operational & Technical Metrics
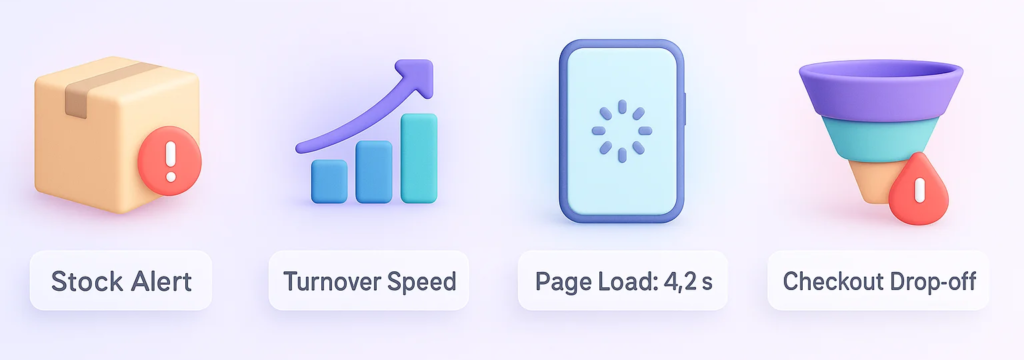
Even with the best marketing strategy, poor operations will sink you.
Track:
Stock Levels: Are bestsellers often out of stock?
Inventory Turnover: How fast are products selling?
Site Performance: Page load times, mobile responsiveness, 404 errors
Funnel Drop-off: Especially during checkout
Tools like Google Analytics or your ecommerce platform reports (e.g., Shopify analytics) can flag technical issues that cost you money.
Key Report Types
Now that you’re tracking key metrics, here are the report types that turn data into growth.
Sales & Order Reports

A sales report gives you the clearest view of your store’s performance.
These comprehensive reports analyze total sales metrics and order activity across different periods and channels.
Daily/Weekly/Monthly/Quarterly Breakdown: Spot short-term spikes and long-term trends. Helps you evaluate promotions, seasonality, and the impact of marketing pushes.
Sales by Product/Category/Channel: Know which items sell best, which categories underperform, and which channels bring in the most consistent revenue.
AOV Trends and Total Revenue Tracking: See if your strategies increase average order value and total sales over time.
These insights can shape your pricing strategy, guide inventory planning, and help you prioritize high-performing products.
Conversion & Funnel Reports
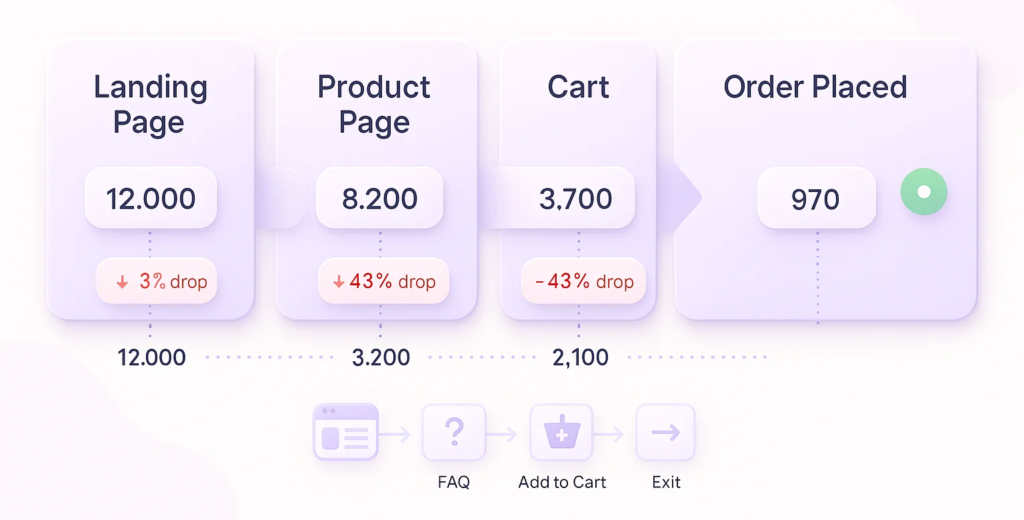
Conversion and funnel reports show how visitors move through your ecommerce site.
They reveal the parts of your customer journey that lead to sales and those that don’t.
Funnel Report: From landing to checkout, see where drop-offs happen.
Conversions by Source/Page/Campaign: Identify what drives action. Which campaigns convert best? Which pages push buyers to checkout?
Spot Drop-Off Points: Use these insights to adjust messaging, layout, or offers on weak pages.
Track the Number of Pages Viewed: Monitor visitors’ pages before converting or dropping off to gauge engagement and content effectiveness.
Pair this with heatmaps and behavioral tools to understand visitor intent. Then, e-commerce reports will be used to track the effect of those changes.
Build trust & FOMO
Highlight real-time activities like reviews, sales & sign-ups.
Marketing Performance Reports

Marketing performance reports tell you what’s working and costing you money.
ROI by Channel: Understand the actual return on each marketing dollar spent on email, PPC, search engine optimization (SEO), and social media.
Attribution Models: Identify which channel assisted or closed the sale.
Campaign Results Across Multiple Sources: Compare performance and allocate budget where it performs best.
With UTM tracking and campaign tagging, you can follow a customer’s path across channels and make smarter decisions in future campaigns.
Customer Reports
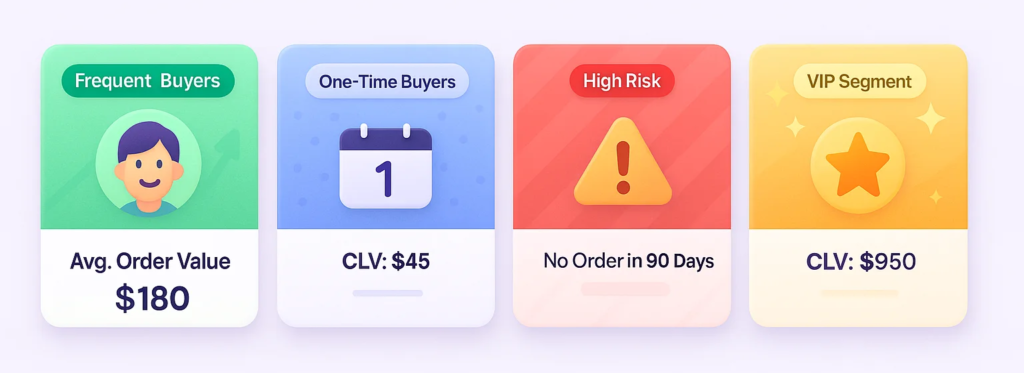
Customer reports dive into who’s buying, how often, and their lifetime value.
Segmentation by Buying Frequency, CLV, Geography: Personalize offers, emails, and experiences by segment.
NPS Scores: Measure satisfaction and predict loyalty.
Churn Prediction: Use behavioral triggers to prevent customer loss.
These reports can help you retain more customers, increase their average order, and build loyalty.
Operational Reports

Operational reports tell you what’s happening behind the scenes, including logistics, site performance, and checkout reliability.
Inventory Reports: Track what’s low, what’s overstocked, and what’s moving fast.
Cart Abandonment Analytics: Spot checkout issues or friction points.
Site Errors: See how 404s, slow loading, and bugs affect user experience and sales.
Keeping operations clean and optimized leads to higher conversion rates and fewer missed sales.
Support & Satisfaction Reports
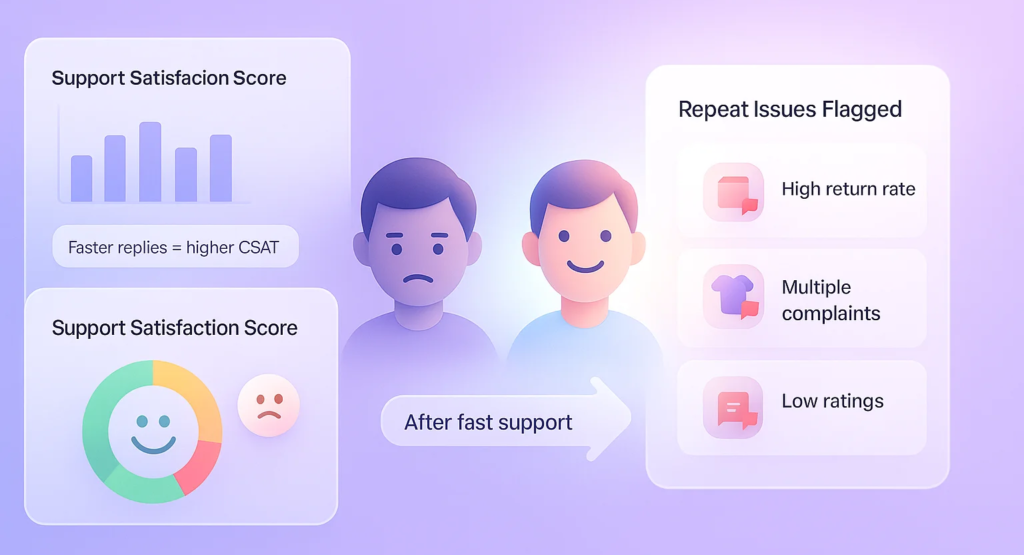
These reports cover the post-purchase experience, which heavily influences whether customers buy again.
Response Time Breakdowns: Shorter times = better satisfaction.
Support Satisfaction Scores: Use them to monitor your team and improve scripts or resources.
Repeat Issues by Product/Category: Flag items causing complaints or confusion.
Improving support based on real data leads to stronger reviews, fewer returns, and more repeat customers.
Best Practices in E‑commerce Reporting

Reporting is applicable only if it drives action.
Here’s how to turn your ecommerce data into better decisions and more sales.
➟ Start with Clear Objectives
Ecommerce reports should answer real business questions.
Instead of just collecting numbers, think about the purpose behind them.
Ask:
- Did average order value improve after our last discount campaign?
- Which traffic source brought in the most paying customers?
- Are returning users spending more than new visitors?
When your report answers a question, it becomes a tool for decision-making, not just a data dump.
➟ Keep Dashboards Simple
One dashboard. One clear goal. That’s the rule.
Don’t overload your ecommerce dashboard with every available metric.
Instead, focus on key performance indicators directly related to sales and conversions.
A clear view makes it easier to act quickly, whether adjusting ad spending or fixing a drop in AOV.
➟ Add Context & Narrative
Numbers show trends. But you also need to explain what’s behind the changes.
- If sales spiked, was it because of an influencer shoutout or a limited-time offer?
- If conversions dropped, was your site speed down or a checkout bug?
Add short notes or flags following key metrics.
This will give stakeholders context and make connecting the dots between activity and results easier.
➟ Consistency & Automation
Set a schedule. Weekly performance reviews, monthly summaries, and quarterly deep dives help spot patterns and track progress.
Use ecommerce reporting software to pull data automatically. This saves time and avoids human error.
A consistent format also makes comparing performance across campaigns or seasons easier.
➟ Segment & Filter Data
All your ecommerce KPIs become more valuable when appropriately segmented.
Slice reports by:
- Traffic source
- Campaign type
- Device type
- First-time vs. repeat customers
These filters give you sharper insights, allowing you to tailor offers, improve landing pages, or retarget more effectively.
➟ Visualize Insights
No one wants to read through 20 rows of numbers.
Use charts, bar graphs, and trend lines to show performance at a glance.
Dashboards with visual clarity speed up decision-making and help teams act with confidence.
➟ Validate & Test
If a report shows a lift in conversion rate, validate it. Use A/B tests and check if the change holds over time.
Example:
- Did adding product reviews under the CTA improve sales?
- Did that new hero banner lower the bounce rate?
Every insight should lead to an action, which should be tested.
➟ Implement Change Management
Reporting is useless unless it leads to action. Create a change log to track decisions made based on report data.
That way, when performance shifts later, you’ll know if a change helped or hurt your results.
Tie every central dashboard insight back to a next step, updating product pages, adjusting ad bids, or pausing a slow campaign.
Build trust & FOMO
Highlight real-time activities like reviews, sales & sign-ups.

Tools & Technology

The right tools don’t just collect ecommerce data, they make it worthwhile.
Choosing the right reporting tool and analytics tool enables you to create custom reports tailored to your business needs, integrating data from multiple sources for comprehensive analysis.
This section breaks down platforms and steps that turn raw numbers into actions that grow your store.
1. Analytics Platforms
Google Analytics 4 (GA4)
Set up GA4 by connecting your ecommerce site or app.
Enable ecommerce tracking to monitor transactions, checkout behavior, and product performance.
Use the “Monetization” section to see purchase trends, funnel steps, and drop-offs.
Export key reports to BigQuery if you need more advanced slicing or automation.
Google Sheets
Ideal for building lightweight custom dashboards.
It can combine multiple sources (GA4, Shopify, Meta Ads) into one view.
Great for goal tracking and team-level weekly reporting.
2. Reporting & BI Tools
Google Data Studio
Connect GA4, Sheets, or your ecommerce platform directly.
Create visual dashboards for sales performance, CAC, ROAS, or funnel health.
Use filters to give different teams (marketing, product, ops) the needed views.
Supermetrics / Improvado / TapClicks
Pull data from ads, email, social, and CRM tools.
Combine and clean it automatically.
Build unified ecommerce dashboards across platforms.
Use these tools when you need to centralize data without doing it manually.
3. Ecommerce Platform Integrations
Shopify / WooCommerce / BigCommerce / Vend POS
Set up native analytics inside the platform for quick views.
Use APIs or plugins to send key metrics (orders, customer data, inventory) to GA4 or your BI tool.
Track store-level metrics like average order value, returning customers, and checkout funnel events.
These integrations ensure your ecommerce reporting software reflects real-time activity from your actual store.
4. Templates & Dashboards
Funnel.io / DashThis / Klipfolio / Porter
Use templates for ecommerce KPIs like total revenue, ROAS, bounce rate, or LTV.
Create prebuilt reports for execs, marketing leads, or performance teams.
Set up auto-refresh schedules to deliver daily or weekly reports via email or Slack.

Start with prebuilt templates, then layer in your custom ecommerce KPIs or UTM-tagged campaigns.
Creating Your Reporting Strategy
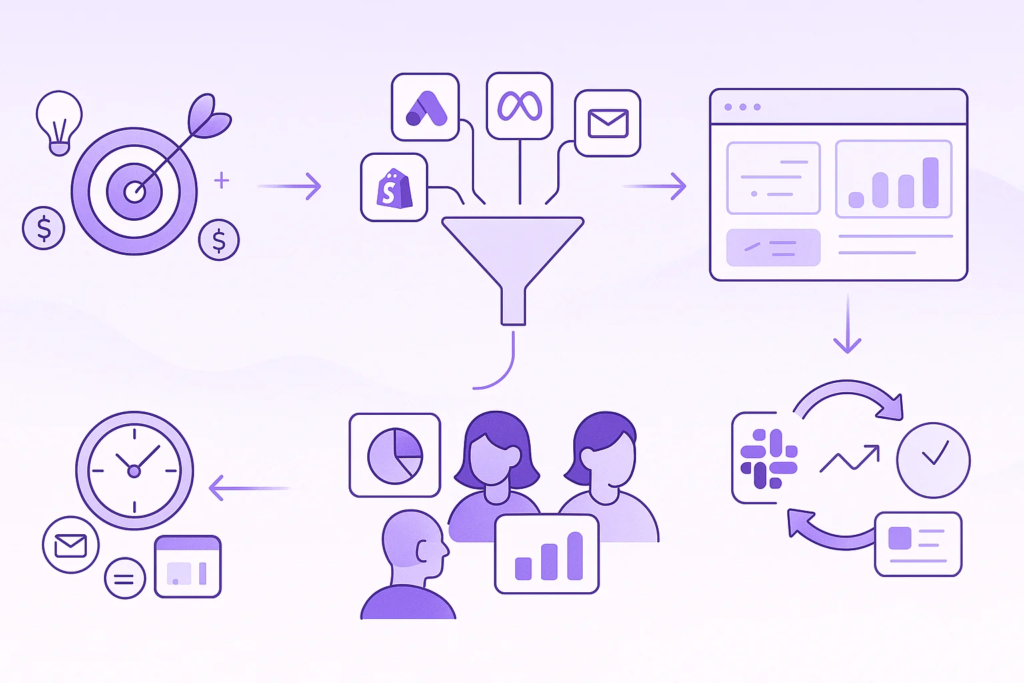
A strong reporting strategy starts with clarity and ends with consistent action.
It’s not just about pulling data; it’s about setting up a system that gives you the correct numbers, at the right time, in the proper format so that you can make smarter decisions.
Step 1: Define Your Goals
Start by identifying what matters most to your business right now.
- Do you need to improve conversion rates?
- Are you focused on reducing cart abandonment?
- Is your goal to increase customer lifetime value?
Each goal should tie to 2–3 key performance indicators (KPIs).
For example:
- Goal: Increase repeat customers → KPIs: Repeat Purchase Rate, CLV, NPS
- Goal: Grow revenue → KPIs: AOV, Total Sales, Funnel Completion Rate
Step 2: Map Your Data Sources
Next, list where your data lives:
- Ecommerce platform (Shopify, WooCommerce, BigCommerce)
- Marketing tools (Meta Ads, Google Ads, Email)
- Analytics platforms (GA4, Google Sheets, Data Studio)
Make sure each platform is connected and tracking correctly.
This gives you a complete picture of customer behavior and campaign performance.
Step 3: Choose the Right Tools
Match tools to your team’s skills and your reporting needs.
- GA4: Core for behavior, traffic, and funnel reports
- Google Data Studio: For building visual reports
- Supermetrics or Improvado: For pulling data from multiple sources
- Shopify Analytics: For quick views and product performance
Use templates as a starting point, then customize to match your goals.
Step 4: Set Up Stakeholder-Focused Dashboards
Different teams need different data:
- Executives: Revenue, ROI, Growth Trends
- Marketing: Channel performance, CAC, ROAS
- Product: Sales by item, returns, NPS
Keep dashboards focused and relevant. Avoid overloading them with unrelated metrics.
Step 5: Automate and Schedule
Automate what you can:
- Daily performance summaries via email or Slack
- Weekly trend reviews in Data Studio
- Monthly complete reports with context and action steps
This ensures everyone stays aligned without chasing data manually.
Step 6: Review, Adjust, Repeat
Set regular check-ins:
- Weekly: Quick wins, traffic surges, tech issues
- Monthly: Campaign analysis, sales growth, retention patterns
- Quarterly: Strategy review, tool adjustments, reporting changes
Use what you learn to adjust your ecommerce strategy, landing pages, campaigns, and product listings.
A good reporting strategy is never static. It grows with your business, adapting as your goals shift.
When done right, it becomes more than a reporting system; it’s a decision engine that confidently guides your next move.
Wrap up
Ecommerce reporting isn’t about tracking everything; it’s about tracking what matters. Start with clear goals, use the right tools, and review your data regularly.
When your reports are built with intent, they turn raw numbers into smart decisions, helping you improve conversions, increase revenue, and build a confidently growing store.
Boost Conversion Instantly
Add Social Proof & Urgency to your website
