A/B testing compares two versions of a page or campaign to see which one performs better.
Users are split into a control group and a treatment group, and teams collect data on metrics such as conversion rate, click-through rate, and average order value to measure the observed difference.
The test follows hypothesis testing. It starts with a null hypothesis and uses statistical analysis, including metrics such as p-value, confidence interval, and statistical significance, to interpret test results.
With the right sample size, statistical power, and confidence level, businesses reduce false positives and use online experimentation and split testing to improve conversion optimization and understand customer behavior.
Key Terms in A/B Testing Statistics
About 77% of companies run A/B tests on their websites to improve conversion rates.
A/B testing can increase conversion rates by 20% to 49% when businesses test page elements and marketing messages.
Around 60% of businesses say A/B testing is their top method for conversion optimization.
Many successful A/B tests achieve conversion improvements of 5% to 20% after testing different variants.
Websites that run continuous testing programs can see up to 30% higher conversion rates over time.
A typical A/B test needs at least 1,000 to 5,000 users per variation to reach reliable statistical significance.
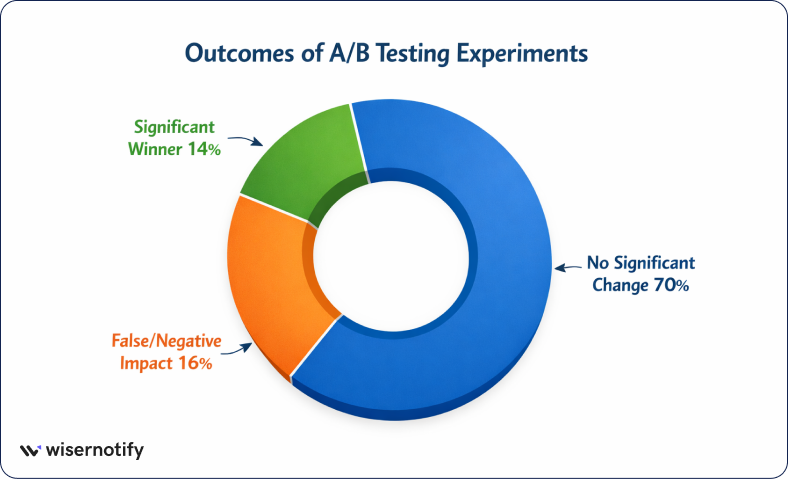
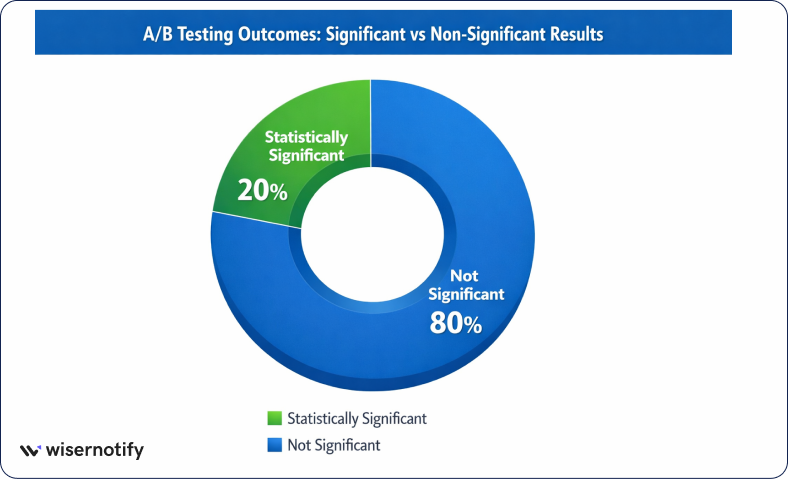
About 1 in 7 A/B tests produce a significant winner that clearly outperforms the control version.
Companies that test regularly can achieve 10% to 25% higher revenue growth from conversion optimization.
Around 70% of marketers use split testing to improve landing pages and campaigns.
Businesses that rely on data-driven testing are 3 times more likely to improve customer engagement and campaign results.
How A/B Testing Works Step-by-Step
A/B testing follows a clear process that helps teams run reliable online experiments and improve conversion rates.
Each step focuses on collecting data, testing ideas, and using statistical analysis to decide which version performs better.
When done correctly, this process helps businesses understand customer behavior and make better decisions based on real test results.
Step 1: Define the Experiment Goal
Every A/B test starts with a clear goal. The goal often focuses on conversion optimization, improving user experience, or increasing revenue.
For example, a team may want to increase sign-ups, improve click-through rate, or raise average order value.
1. Studies show that A/B testing can increase conversion rates by 20% to 49% when businesses test page elements and marketing messages.
2. Companies that run continuous testing programs can also see up to 30% higher conversion rates over time.
Clear goals help teams measure the impact of each experiment and focus on meaningful improvements.
Step 2: Form a Statistical Hypothesis
After defining the goal, teams create a statistical hypothesis.
This usually includes a null hypothesis (H0), which assumes there is no difference between versions, and an alternative hypothesis (H1), which suggests that a change will improve results.
3. Research shows that about 77% of companies run A/B tests to verify ideas instead of relying on guesses.
Hypothesis testing helps teams evaluate results statistically and decide whether the observed difference between two versions is meaningful.
Step 3: Create Variants
Next, teams create the variations that will be tested. Version A is the control group, while version B is the new variation.
This change may involve a different headline, layout, call to action, or product presentation.
4. Many successful experiments achieve conversion improvements of 5% to 20% after testing different variants.
To ensure reliable test outcomes, teams usually change only one element at a time so they can clearly measure the effect of that change.
Step 4: Split Traffic Randomly
Once the variants are ready, website traffic is split between them. Users are randomly assigned to either the control group or the treatment group.
Random assignment ensures both groups are similar and prevents bias in the experiment.
5. In many experiments, only 1 in 7 A/B tests produces a significant winner, which is why fair traffic distribution and proper testing conditions are important for reliable results.
Step 5: Collect Experiment Data
During the experiment, teams collect data from user interactions. They track actions such as clicks, purchases, sign-ups, and time spent on the page.
6. A typical A/B test often needs 1,000 to 5,000 users per variation to reach reliable statistical significance.
Collecting sufficient data helps increase statistical power and ensures that the test results reflect real user behavior.
Step 6: Analyze Results Statistically
After collecting enough data, teams analyze the results using statistical methods.
They compare metrics such as conversion rate, click-through rate, and revenue per visitor to measure the observed differences between the variants.
7. Businesses that rely on data-driven testing can achieve 10% to 25% higher revenue growth through continuous experimentation and conversion optimization.
Statistical analysis helps determine whether the change is a significant winner or if further testing is needed.
Core Statistical Concepts Behind A/B Testing
In a controlled experiment, two groups see different versions, and teams compare the observed differences in conversion rates, click-through rates, or average order values.
Statistical methods help data scientists determine whether the change reflects a true difference in customer behavior or is due to chance.
Hypothesis Testing
The null hypothesis assumes no underlying difference between the control and treatment groups, while the alternative hypothesis suggests that variation B performs better.
8. Studies show that about 77% of companies run A/B tests to validate ideas through statistical testing instead of guessing.
This framework helps teams analyze test outcomes and make decisions based on statistical inference rather than assumptions.
P-Value
The p-value is a key metric in statistical analysis. It measures the probability that the observed difference between two groups could have occurred by random chance under the null hypothesis.
9. In most experiments, teams use a p-value threshold of 0.05, which means there is only a 5% chance that the results occurred randomly.
When the p-value falls below this significance level, the test results are usually considered statistically significant.
Statistical Significance
Statistical significance helps teams determine whether a test has produced a meaningful result.
It shows whether the observed value is likely to represent a true difference between two variables.
10. Most A/B testing programs use confidence levels such as 90%, 95%, or 99% when evaluating test results.
11. In practice, around 1 in 7 A/B tests produce a significant winner, which means the variation clearly performs better than the control version.
Confidence Intervals
A confidence interval provides a range that likely contains the true value of the experiment outcome.
Instead of looking only at a single observed value, it shows the range in which the real effect probably exists.
12. For example, a 95% confidence interval means the true difference between two versions is expected to fall inside that range most of the time.
This method improves reliability because it shows both the effect size and the uncertainty around the result.
Type I and Type II Errors
Statistical testing can lead to two common errors in A/B testing results.
A Type I error is a false positive. It occurs when a test yields a statistically significant result even though there is no true difference between the control and treatment groups.
A Type II error occurs when a real improvement exists, but the test fails to detect it.
13. Many experiments are designed with 80% statistical power, meaning there is an 80% chance of detecting a real effect if one exists.
Sample Size and Experiment Duration
Sample size and experiment duration play a major role in the reliability of A/B testing results.
When an experiment collects enough data from users, the statistical analysis becomes more stable and the results better represent the larger population.
Why Sample Size Matters
Sample size determines how reliable your experiment results will be. When the sample size is too small, random variation can lead to misleading results and make the observed difference unreliable.
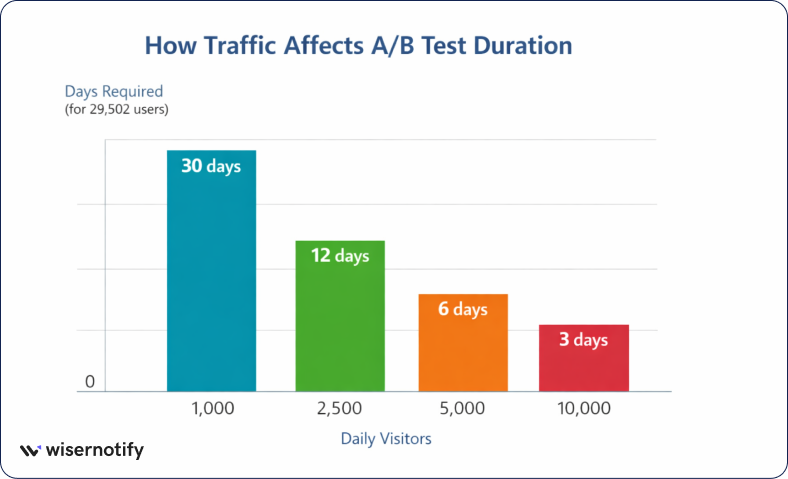
14. For example, detecting a small change in conversion rates often requires about 14,751 users per variant (around 29,502 total users) in a typical experiment setup.
Larger sample sizes reduce statistical noise and help teams measure real differences between the control and treatment groups.
Minimum Detectable Effect (MDE)
Minimum Detectable Effect (MDE) represents the smallest improvement that an experiment is designed to detect. It defines the minimum change in conversion rates or other metrics that the test should be able to measure.
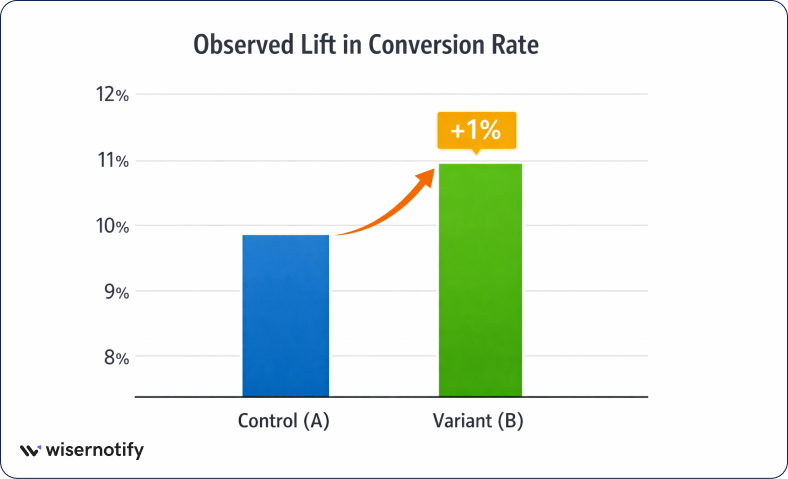
15. For example, detecting a 1% absolute increase in conversion rate (from 10% to 11%) requires a much larger sample size than detecting a larger improvement.
Because of this, the chosen MDE directly affects experiment design and how much traffic the test needs.
Statistical Power
Statistical power measures the probability that a test will detect a real improvement if it actually exists. Higher statistical power means the experiment is more likely to find true differences between variants.
16. Most experimental programs aim for 80% statistical power, meaning the test has an 80% chance of detecting a real effect if the change improves performance.
Determining Test Duration
Test duration depends on traffic volume and the required sample size. Experiments with higher traffic collect data faster and reach statistical significance sooner.
17. For example, if a test needs 29,502 users and a website receives 5,000 visitors per day, the experiment would need about 6 days to collect enough data.
Running the test until the required sample size is reached helps avoid early stopping and improves the reliability of the final results.
Statistical Tests Used in A/B Testing
A/B testing relies on statistical tests to compare two groups and determine whether the observed difference between versions is meaningful.
These statistical methods help teams analyze experimental data, measure conversion rates, and determine if the results are statistically significant.
Different tests are used depending on the type of data, sample size, and experiment design.
Z-Test
A Z-test is commonly used in A/B testing when the experiment has a large sample size.
It compares conversion rates between the control group and the treatment group and determines whether the difference is statistically significant.
18. If the control group has 10% conversion rate (2,000 of 20,000) and variation B has 11% (2,200 of 20,000), the z-test statistic is approximately 3.26, indicating a statistically significant improvement.
T-Test
A t-test compares the average value of a metric between two variants.
It is often used when analyzing metrics such as average order value, revenue per user, or time spent on a page, especially when the sample size is small.
19. In one example, with 1,600 users in each group, the average value changes from 50 to 51.
Chi-Square Test
The chi-square test is used when analyzing categorical experimental data. It helps determine whether the distribution of users between experiment groups follows the expected ratio.
For example, if a test expects a 50/50 traffic split but observes 10,200 users in group A and 9,800 users in group B, the chi-square test checks whether this difference happened randomly or indicates a potential experiment issue.
Bayesian A/B Testing
Bayesian A/B testing uses probability to interpret results instead of relying only on p-values. It calculates Pr(B > A), the probability that variation B performs better than the control.
20. For example, if the analysis shows Pr(B > A) = 0.95 (95%), it means there is a 95% probability that variation B outperforms version A, based on the collected experiment data.
Real Example of A/B Testing Statistical Analysis
A real A/B testing example shows how statistical analysis helps teams understand whether a change improves conversion rates.
By running a controlled experiment and comparing two versions, businesses can measure the observed difference, analyze the test results, and decide which variant performs better.
Example Scenario: Landing Page Experiment
A company runs a landing page experiment to test two headlines. Version A is the control page, while variation B shows a new headline.
The goal of the test is to increase the conversion rate through better messaging and improved user engagement.
21. In many online experiments, even a 1% increase in conversion rate can create a meaningful business impact when the page receives thousands of visitors.
Data Collection
The experiment collects data from website visitors who are randomly assigned to each variant.
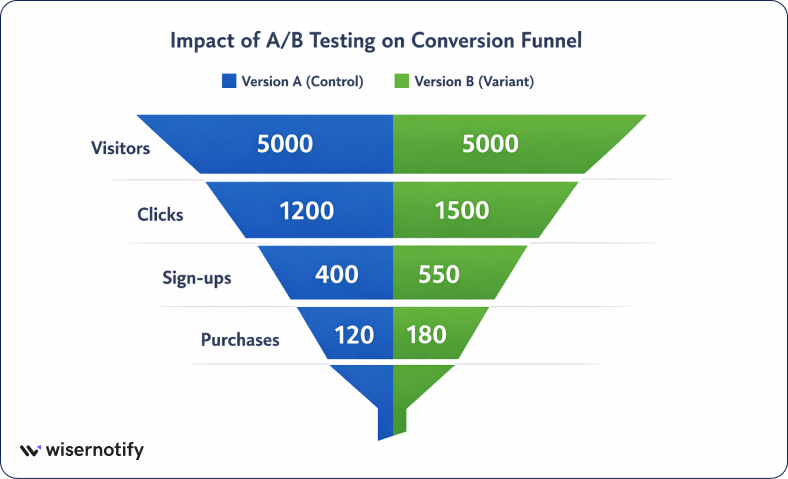
22. For example, the experiment receives 20,000 visitors per variant, where the control page records 2,000 conversions (10%) and variation B records 2,200 conversions (11%) for statistical analysis.
Statistical Analysis
Next, the team compares conversion rates between the two groups to measure the observed difference.
23. In this case, the difference between 10% and 11% conversion rates is a 1% absolute improvement, and the statistical test yields a z-statistic of about 3.26, indicating that the change is statistically significant.
Interpreting the Outcome
After analyzing the test outcomes, the team interprets the results and decides the next step.
24. Since variation B shows a statistically significant improvement with a 1% higher conversion rate, it becomes the significant winner.
The business can then deploy the new headline to all users and continue further experimentation to optimize performance.
Advanced Statistical Topics in A/B Testing
As experimentation programs grow, teams often use more advanced statistical methods to improve test accuracy and decision-making.
These approaches help data scientists handle continuous monitoring, multiple variants, and deeper analysis of customer behavior during online experimentation.
Sequential Testing
Sequential testing allows teams to monitor experimental results continuously rather than waiting until the end of the test.
This approach helps teams react faster when a variation performs better or worse.
However, repeatedly checking results can increase false positives if the test was designed for a fixed sample size.
25. Research shows that peeking at results multiple times can increase false positive risk by 15%–30% if the test was designed for a fixed sample size.
Multi-Variant Testing
Multi-variant testing expands A/B testing by testing multiple variants at the same time instead of just version A and version B.
26. For instance, an experiment may test 3 or 4 different page variations simultaneously to identify the best-performing design.
This approach can discover better-performing combinations faster but usually requires more traffic and a larger sample size.
Multi-Armed Bandit Algorithms
Multi-armed bandit algorithms use adaptive experimentation to adjust traffic allocation during a test. Instead of splitting traffic evenly, the system gradually sends more users to the better-performing variation.
For example, traffic may start with a 50/50 split, but as the algorithm learns from the data, it may shift traffic to 70% or more toward the higher-performing variant, improving overall conversion optimization during the experiment.
Segmentation Analysis
Segmentation analysis examines test outcomes across different user groups to understand how customer behavior varies.
27. For example, an experiment may show an overall 1% conversion improvement, but segmentation analysis could reveal that mobile users improve by 2% while desktop users show no change.
This deeper analysis helps teams understand the underlying difference and apply targeted optimizations.
Common A/B Testing Statistical Mistakes
Even well-planned experiments can produce misleading results if basic statistical rules are ignored.
Many A/B testing mistakes happen when teams rush experiments, analyze incomplete data, or design tests poorly. Understanding these issues helps businesses run reliable experiments and interpret results correctly.
Stopping Tests Too Early
Stopping an experiment before enough data is collected is one of the most common mistakes.
When the sample size is too small, random variation can appear as a real improvement.
28. For example, detecting a 1% change in conversion rate may require about 14,751 users per variant. Ending the test early with fewer users can produce misleading results and false conclusions.
Ignoring Statistical Significance
Looking only at raw numbers without statistical testing can also lead to incorrect decisions.
A small difference in conversions may appear meaningful, but could simply be due to randomness.
29. Studies show that about 80% of experiments fail to reach statistical significance, which means most tests do not produce a clear winner.
Running Too Many Tests Simultaneously
Running many experiments or testing too many variants at once increases the chance of false positives. This issue is known as the multiple testing problem.
30. For example, if 20 independent tests are run with a 0.05 significance level, the probability of at least one false positive can rise to about 64%.
Poor Experiment Design
Poor experiment design can also distort test outcomes. Problems such as confounding variables or improper traffic distribution make it difficult to isolate the real effect of a change.
A common issue occurs when traffic is not split evenly. If a test expects a 50/50 split but receives 10,200 users in group A and 9,800 in group B, the imbalance may indicate data issues or tracking errors that undermine the experiment’s reliability.
Best Practices for Reliable A/B Testing Statistics
Running reliable A/B tests requires proper planning, accurate data collection, and correct statistical analysis.
Following a few best practices helps teams reduce errors, interpret results correctly, and make confident decisions from their experimentation program.
Define a Clear Hypothesis
Every experiment should start with a clear hypothesis. The hypothesis explains what change is being tested and what outcome is expected.
For example, a team may test whether a new headline increases conversion rates. The hypothesis defines the control version, the treatment version, and the expected improvement. Clear experiment planning makes it easier to analyze results and avoid random testing.
Use an adequate sample size
A reliable test needs enough users to produce meaningful results. Small sample sizes increase statistical noise and make it harder to detect a true difference.
Planning the appropriate experimental scale helps ensure the test reaches statistical significance and reduces the risk of misleading results.
Track the Right Metrics
Choosing the right metric is essential for interpreting experiment outcomes. Most A/B tests focus on a primary KPI such as conversion rate, click-through rate, or average order value.
Tracking a single primary metric helps teams evaluate whether the tested change improves business performance.
Validate Data Quality
Clean data is critical for accurate statistical analysis. Tracking errors, missing events, or incorrect traffic distribution can distort experiment results.
A proper analytics setup ensures user actions are recorded correctly, traffic is split fairly, and the collected data reflects real customer behavior.
Tools for A/B Testing Statistical Analysis
Modern A/B testing relies on both experimentation platforms and data analysis tools.
These tools help teams run controlled experiments, collect test data, and perform statistical analysis to interpret results accurately.
Experimentation Platforms
Several platforms help businesses run A/B tests and analyze experiment results without a complex setup.
Optimizely
Optimizely is a popular experimentation platform used for online experimentation and conversion optimization.
It helps teams run controlled experiments, split traffic between variants, and analyze statistical significance with built-in testing tools.
VWO
VWO provides split testing and multi-variant testing tools for websites and landing pages.
It allows marketers to create variation B designs, monitor conversion rates, and track customer behavior to improve digital marketing performance.
GrowthBook
GrowthBook is an open-source experimentation platform designed for product teams and data scientists.
It supports feature experiments and statistical testing and integrates with analytics systems to evaluate experimental results.
Data Analysis Tools
Many teams also analyze A/B testing data using programming and analytics tools for deeper statistical analysis.
Python (SciPy, Statsmodels)
Python libraries such as SciPy and Statsmodels help data scientists perform statistical hypothesis tests like the z-test and t-test.
These tools are widely used for statistical inference, experiment analysis, and building custom experimentation programs.
R Statistical Software
R is widely used for advanced statistical methods and experimental analysis.
It supports hypothesis testing, statistical modeling, and detailed data exploration for A/B testing experiments.
SQL Analytics
SQL is commonly used to extract experimental data from databases.
Teams use SQL queries to collect test data, calculate conversion rates, compare experiment groups, and prepare datasets for deeper statistical analysis.
Conclusion
A/B testing statistics help businesses understand whether a change truly improves conversion rates or happens by chance. Using statistical testing and data analysis allows teams to compare variants and interpret test results with confidence.
Reliable experiments require a clear hypothesis, enough sample size, and accurate data collection. When tests follow proper statistical methods, businesses reduce false positives and make better decisions.
Consistent online experimentation helps improve customer behavior, optimize digital marketing, and drive steady growth through data-driven insights.
