
Landing pages help turn visitors into leads or customers. Businesses use landing pages in ads and marketing campaigns to guide users to a single action, such as filling out a form or clicking a call to action.
Marketers track landing page statistics such as conversion rate, user behavior, and performance to understand how people interact with a page. This data helps teams improve landing page conversion and find what works best.
Learning from landing page analytics and testing different ideas helps marketers optimize landing pages and build highly converting ones that drive better results.
Landing Page Statistics (Quick Highlight)
The median landing page conversion rate across industries is about 6.6%.
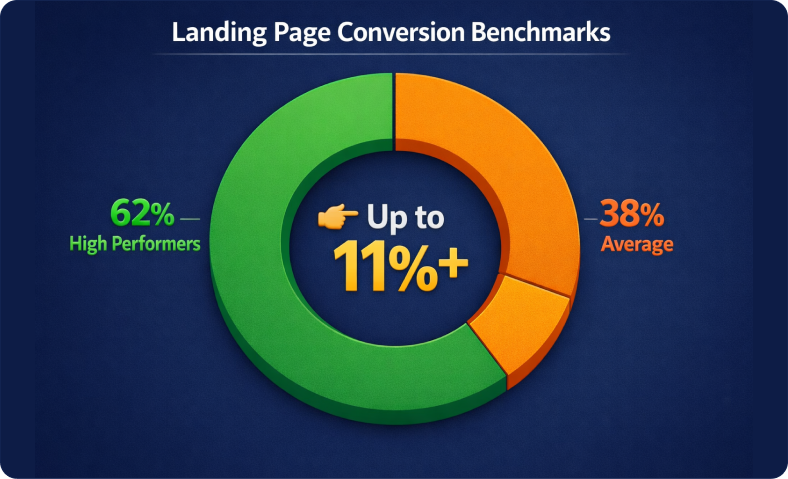
Top-performing landing pages often reach conversion rates above 11%.
The median ecommerce landing page conversion rate is around 4.2%.
The average bounce rate for retail websites is close to 46%.
Improving page speed by 100 milliseconds can increase revenue per session by about 0.7%.
Faster page load times have helped some brands increase mobile conversions by up to 52%.
A small headline change on a landing page has increased conversions by 104% in some tests.
A performance improvement in page loading helped one site increase sales by 8%.
A faster website experience improved the lead-to-visit rate by 15% in a performance test.
A page speed improvement increased cart-to-visit rate by 11% in one case study.
General Landing Page Statistics
Landing pages play a key role in digital marketing and lead generation.
Looking at landing page statistics helps marketers understand how different pages perform and where improvements can increase conversions.
Conversion Rate Benchmarks
Conversion rate is one of the most important metrics for measuring landing page performance.
It shows how many visitors take the desired action after arriving on the page. Benchmarks help marketers understand whether a landing page conversion rate is average or needs improvement.
1. The average landing page conversion rate across industries is around 6.6%.
2. High-performing landing pages can reach conversion rates above 11%.
3. B2B landing pages often convert between 2% and 5%, while B2C landing pages usually range from 3% to 8%.
Number of Landing Pages and Lead Generation
The number of landing pages a business creates can directly affect lead generation.
Companies that build multiple landing pages for different campaigns, audiences, or offers usually see better results than those using only one page.
4. Businesses with 10 or more landing pages generate about 55% more leads than those with fewer pages.
5. Companies with 30 or more landing pages can generate up to 7× more leads than those with fewer than 10 pages.
Traffic Source Performance
Different traffic sources bring visitors with different levels of intent. Understanding these patterns helps marketers improve marketing campaigns and create dedicated landing pages for each traffic source.
6. Paid search traffic often converts at around 2–3% on landing pages.
7. Email marketing landing pages can reach conversion rates of around 5–15%.
8. Social media traffic typically converts between 0.7% and 1.5% on average.
Landing Page Conversion Rate Statistics
Conversion rate shows how many visitors take the action you want, such as signing up, downloading a guide, or making a purchase.
Looking at landing page conversion rate statistics helps marketers understand what improves results and what reduces conversions.
Small changes in design, forms, or messaging can make a big difference in how visitors respond.
Average Conversion Rate by Industry
Conversion rates vary by industry because each sector has a different user intent and sales cycles. For example, a SaaS demo request works differently from an ecommerce purchase.
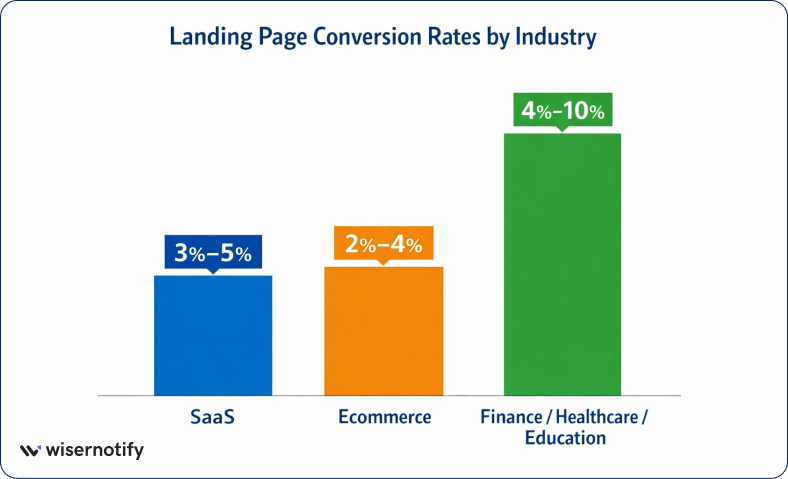
9. SaaS landing page conversion rate usually ranges between 3% and 5%.
10. Ecommerce landing pages often convert around 2% to 4% on average.
11. Finance, healthcare, and education landing pages often convert between 4% and 10%, depending on the offer and audience.
High-Converting Landing Page Elements
Certain page elements have a strong impact on conversion rates. These elements help visitors understand the offer and encourage them to take action.
12. Clear headlines can increase conversions by up to 20% in many A/B tests.
13. Call-to-action (CTA) buttons placed above the fold can improve conversions by 30% or more.
14. Adding images or video content can increase engagement and improve conversion rates by around 20–80% in some campaigns.
15. Showing social proof, such as reviews or testimonials, can increase conversions by about 34%.
Form Optimization Statistics
Forms are among the most important elements of many landing pages. The number of fields and form structure can strongly affect form submissions.
16. Multi-step forms can improve completion rates by up to 14% compared with long single forms.
Simple email capture forms often convert at 2–3× the rate of longer lead forms.
Landing Page Design Statistics
Landing page design has a strong impact on user engagement and conversions. The layout, visuals, and placement of key elements can change how visitors interact with a page.
Good design helps visitors understand the offer quickly and makes it easier for them to take action.
Visual Content and Engagement
Visual content helps convey the message more quickly and keeps visitors engaged on the page.
Images and videos can make a landing page easier to understand and more persuasive.
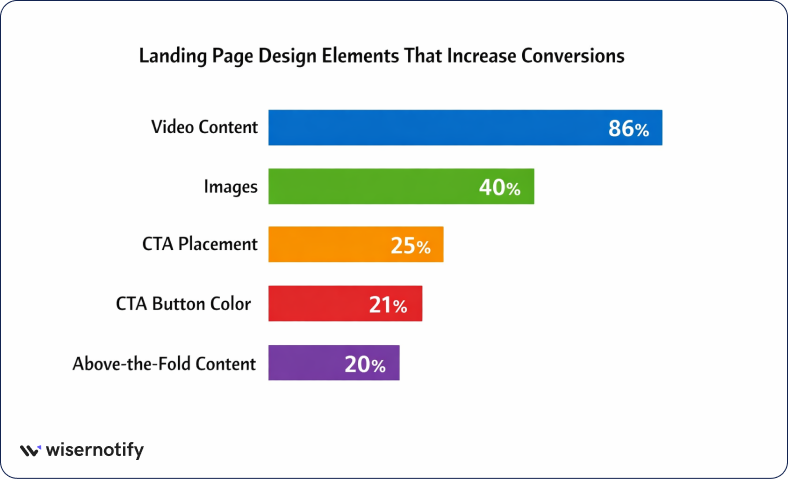
17. Landing pages with relevant images can increase conversions by about 40%.
18. Adding video content to a landing page can increase conversions by up to 86%.
Layout and UX Statistics
Page layout and user experience influence how visitors read and interact with a landing page. Simple design and clear structure often lead to better results.
19. Placing important content above the fold can increase conversions by around 20%.
20. Improving readability and white space can increase user attention by about 20%.
CTA Button Statistics
The call-to-action button is one of the most important elements on a landing page. Its design, placement, and wording can strongly affect click-through rates.
21. Changing the CTA button color can increase click-through rates by about 21%.
22. Placing a CTA button above the fold can increase conversions by around 25%.
23. Using clear CTA copy, such as “Start Free Trial” or “Get Started Now,” can increase clicks by about 90% compared with generic text like “Submit.”
Mobile Landing Page Statistics
Mobile devices now drive a large share of landing page traffic. Many visitors first see a mobile landing page through ads, search results, or social media links.
Because of this shift, businesses must focus on mobile optimization, fast loading pages, and simple layouts to maintain strong landing page performance.
Mobile Traffic Trends
User behavior on mobile devices differs from that on desktops. Mobile visitors often browse quickly and expect simple, easy-to-use pages.
24. Around 58–60% of landing page traffic now comes from mobile devices.
25. Mobile landing page conversion rates are often 10–20% lower than desktop conversions.
Mobile Page Speed Statistics
Page speed plays a major role in mobile conversions. Slow pages cause visitors to leave before they interact with the content.
26. A 1-second delay in page loading can reduce conversions by about 7%.
Mobile UX Best Practices
Mobile landing pages must be simple and easy to interact with. Design choices that reduce effort for mobile users usually increase conversions.
27. Thumb-friendly buttons can increase click-through rates by around 15–20%.
28. Short forms with fewer fields can improve mobile form submissions by about 20–30%.
29. Mobile-optimized CTA buttons can increase conversions by about 25%.
Landing Page Speed and Performance Statistics
Page speed directly affects user behavior and conversions. When pages load slowly, visitors often leave before reading the content or clicking the call to action.
Faster pages improve landing page performance, increase engagement, and help businesses capture more leads or sales.
Page Load Time and Conversions
Loading time strongly affects how visitors respond to a landing page. Even small delays can reduce conversions.
30. A 1-second delay in page load time can reduce conversions by about 7%.
Pages that load in 2 seconds or less often see the best engagement and conversion performance.
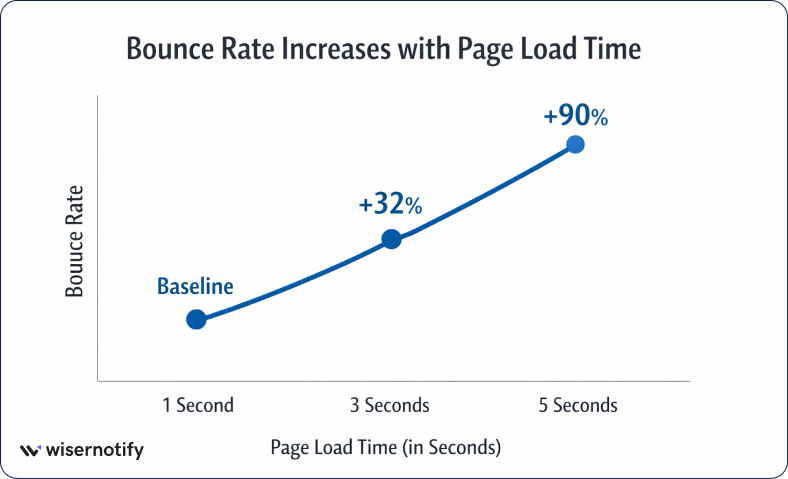
Bounce Rate Statistics
Slow pages increase bounce rates because visitors leave before interacting with the content.
31. If page load time increases from 1 second to 3 seconds, the bounce rate can increase by about 32%.
32. If loading time reaches 5 seconds, bounce rates can increase by about 90%, especially for mobile visitors.
Performance Optimization Impact
Improving performance can lead to better conversion rates and stronger user engagement.
33. Faster websites can improve conversions by 10–20% in many optimization tests.
34. Improving Core Web Vitals metrics, such as loading speed and responsiveness, has increased conversions by up to 8% in some performance experiments.
Landing Page Personalization Statistics
Personalization helps businesses show the right message to the right visitor.
Instead of showing the same page to everyone, marketers adjust content based on location, traffic source, or user behavior.
This approach improves landing page conversion because visitors see offers that match their needs.
Personalized Landing Pages
Personalized content can make landing pages more relevant and improve engagement.
35. Personalized landing pages can increase conversions by about 20% compared with generic pages.
36. Dynamic landing pages that change content based on visitor data can improve conversions by 30% or more.
Audience Segmentation Results
Segmenting visitors allows marketers to create landing pages that match specific audiences.
37. Personalized offers by audience segment can increase conversions by around 50% in some campaigns.
38. Geo-targeted landing pages can improve conversions by about 20% by showing location-specific content.
AI and Dynamic Content
AI tools help marketers personalize landing pages automatically based on user behavior and campaign data.
39. AI-driven landing page personalization can increase conversions by about 25%.
40. Businesses using automated landing page optimization tools often see conversion improvements between 15% and 30%.
A/B Testing Landing Page Statistics
A/B testing helps marketers improve landing page conversion by testing different versions of a page.
Instead of guessing what works, teams compare headlines, layouts, and call-to-action buttons to see which version performs better.
This process helps increase conversions and improve marketing campaign performance over time.
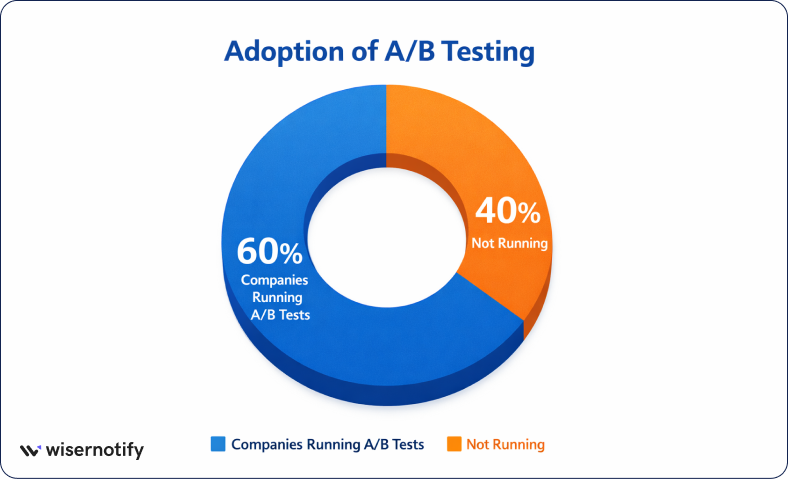
Businesses That Run A/B Tests
Many companies now use conversion rate optimization (CRO) testing to improve landing page results. Testing helps marketers understand how small changes affect user behavior and conversions.
41. Around 60% of companies run A/B tests to improve website or landing page performance.
42. Businesses that actively run CRO experiments can see marketing ROI increase by about 30%.
Common Elements Tested
Marketers usually start testing the elements that have the biggest impact on user decisions.
43. Testing headlines can improve conversions by about 20–30%.
44. Changes to CTA buttons can increase click-through rates by around 21%.
45. Testing images or visual content can improve conversions by about 10–25%.
46. Optimizing forms and form fields can increase form submissions by up to 50%.
A/B Testing Success Rates
Testing helps businesses learn what works best for their audience. Even small improvements can increase conversions over time.
47. Many A/B testing experiments improve conversions by 10–30%.
Companies that run continuous optimization tests often see steady conversion growth over time.
Landing Page Lead Generation Statistics
Landing pages are one of the most effective tools for lead generation. Unlike a homepage, a landing page focuses on a single offer and a single action.
This makes it easier for visitors to understand the value and complete a form or sign up.
Lead Capture Statistics
Businesses often use landing pages to collect emails, demo requests, or downloads. Because the page focuses on one offer, it usually performs better than general pages.
48. Landing pages can generate up to 5× more leads than a typical homepage.
49. Using gated content such as guides or reports can increase lead capture rates by about 30–40%.
Lead Magnet Performance
Lead magnets encourage visitors to share their contact details in exchange for something valuable. The type of offer often affects how many leads a landing page collects.
50. eBooks and guides can generate conversion rates of 20–30% on lead-generation pages.
51. Free trials or product demos often convert around 10–20%, depending on the product.
52. Discount offers can increase sign-ups or purchases by about 20%.
Trust Signals and Social Proof
Trust signals help visitors feel confident before sharing their details. Adding proof elements to landing pages often improves conversions.
53. Showing testimonials can increase conversions by about 34%.
54. Case studies can improve conversion rates by around 15–20%.
55. Displaying reviews or trust badges can increase form submissions by about 30%.
Common Landing Page Mistakes (Supported by Statistics)
Many landing pages fail because of simple design or usability mistakes.
Small issues such as too many links, unclear calls to action, or slow-loading pages can reduce conversions and increase bounce rates.
Examining common mistakes, backed by statistics, helps marketers understand what to avoid.
Too Many Distractions
Landing pages should focus on one goal. When pages include extra links or navigation menus, visitors may leave the page before completing the main action.
56. Removing navigation menus can increase conversions by about 28%.
Pages with many links can reduce user focus and lower conversion rates.
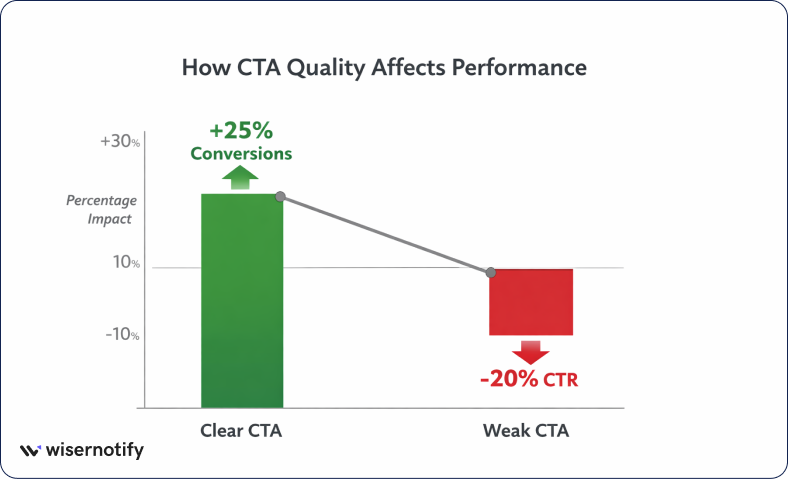
Poor CTA Visibility
The call-to-action button is the most important element on a landing page. If visitors cannot easily see or understand the CTA, they are less likely to take action.
57. Clear and visible CTA buttons can increase conversions by about 25%.
58. Weak CTA wording can reduce click-through rates by more than 20%.
Long or Complex Forms
Forms that ask for too much information often discourage visitors from completing them.
59. Reducing the number of form fields can increase conversions by up to 50%.
60. Long forms can cause form abandonment rates above 60%.
Slow Pages loading speed
Page speed directly impacts landing page conversions and user behavior.
61. A 1-second delay in page load time can reduce conversions by about 7%.
62. When page load time increases from 1 second to 5 seconds, the bounce rate can increase by up to 90%.
Key Takeaways From Landing Page Statistics
Landing page data shows clear patterns about what improves conversions and what causes visitors to leave. Speed, simple design, and targeted messaging play a major role in landing page success. Marketers who understand these insights can build pages that convert more visitors into leads or customers.
Top Insights Marketers Should Know
Several key insights appear consistently across landing page statistics. These patterns help marketers focus on the changes that produce the biggest results.
- Page speed directly impacts conversions. Even small delays in loading time can reduce conversion rates and increase bounce rates.
- Personalized landing pages improve engagement and conversions. Visitors respond better when the content matches their needs or traffic source.
- Businesses with multiple landing pages generate more leads because they can target different audiences and campaigns more effectively.
How to Use These Statistics in Your Strategy
These insights can help marketers improve landing page performance and build stronger campaigns.
- Focus on conversion rate optimization by testing headlines, forms, and call-to-action buttons.
- Improve landing page design with clear messaging, simple layouts, and strong visual hierarchy.
- Use these insights to optimize marketing campaigns by creating dedicated landing pages for each audience, offer, or traffic source.
Conclusion
Landing page statistics show that a strong landing page design, a clear call to action, and a fast page speed help increase conversion rates. When pages focus on one goal and remove distractions, landing pages convert more visitors into leads.
Marketers can improve landing page performance through conversion rate optimization. Testing headlines, forms, and layouts helps understand user behavior and improve results over time.
Using these insights helps businesses optimize landing pages, improve marketing campaigns, and generate more lead generation opportunities.
