
The U.S. real estate market is shifting, and Zillow statistics give a clear view of what is happening in 2026.
Data from Zillow show that home values are stabilizing, while more homes are listed for sale across home types such as single-family residences, condos, and co-ops.
The Zillow Home Value Index shows that price growth has slowed, and more sellers are making a price cut to attract buyers. At the same time, changes in interest rates are affecting buyer demand and the speed at which Zillow homes are selling.
In this guide, you will find 50+ Zillow statistics covering home values, housing inventory, for sale trends, and key real estate insights to help you understand the market in 2026.
Key Zillow Statistics (Quick Snapshot)
The Zillow Home Value Index shows the average U.S. home value is around $360,000 in 2026, with just +0.2% year-over-year growth.
U.S. home values have increased by over 63% since 2018, rising from about $221,000 to $360,000.
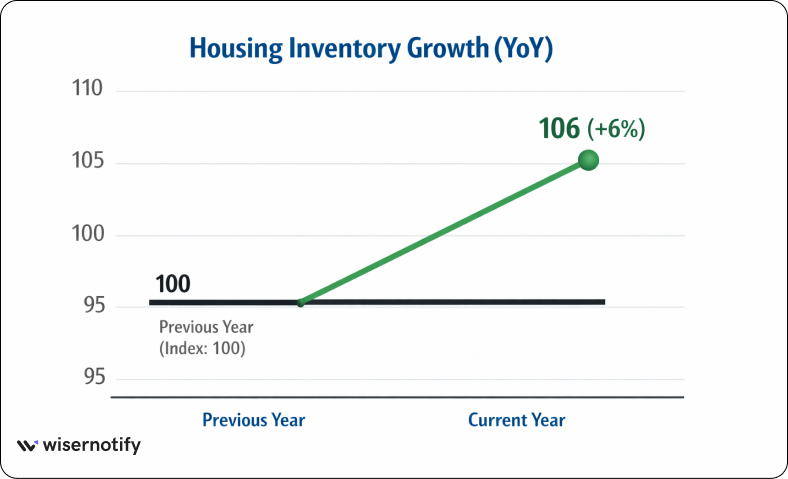
There are approximately 1.11 million homes for sale, up about 6% compared to last year.
Around 242,000 new Zillow home listings were added in a recent month, down 5.5% year over year.
The median time to sell a Zillow home is about 39 days, showing slower market movement.
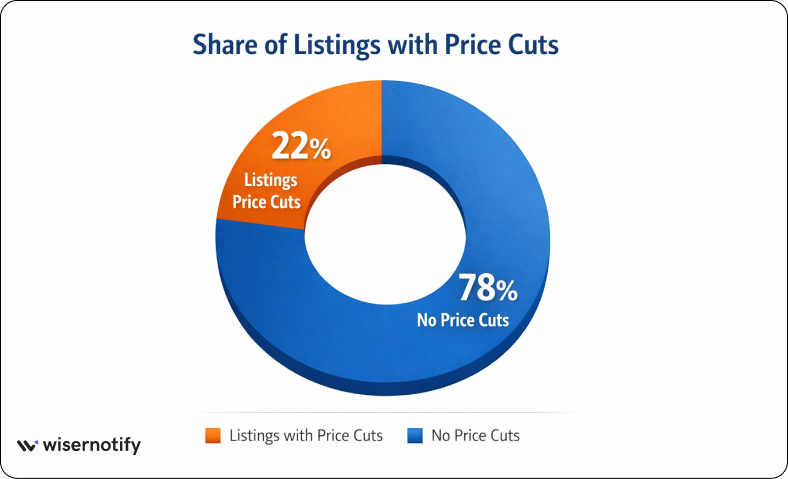
About 22% of homes had a price cut, reflecting weaker buyer demand.
Only 22% of homes sold above list price, compared to over 50% during peak market years.
The average monthly mortgage payment is $1,733, down 8.4% year over year due to easing interest rates.
Zillow rent estimates show average rents near $1,895, with about +1.9% yearly growth.
Foreclosures make up only about 3% of total sales, staying at historically low levels.
All your reviews in one place
Zillow User & Traffic Statistics
Zillow is a leading real estate platform where buyers, sellers, and renters explore Zillow homes, rental listings, and properties for sale.
It provides data such as the Zillow Home Value Index, a seasonally adjusted measure that tracks the typical home value across home types, including single-family residences, condo units, and co-ops.
Monthly Visitors and App Usage
Zillow attracts significant traffic from consumers who are actively shopping for properties or rentals, or exploring home value estimates.
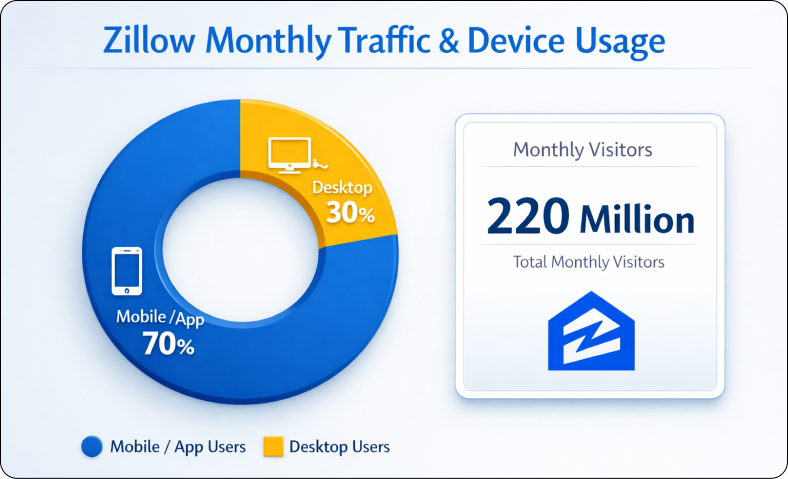
1. Zillow gets over 220 million monthly unique visitors, making it one of the most visited real estate websites.
2. Over 70% of users access Zillow through mobile apps and devices, showing strong app usage.
3. The platform hosts millions of listings, including single-family homes, condominium units, and rental listings.
4. Users spend around 8–10 minutes per visit, reviewing property data, price trends, and housing types.
User Demographics
Zillow users include buyers, renters, and real estate professionals who rely on data and insights to make decisions.
5. Around 60% of users are aged 25–44, the most active group in buying and renting homes.
6. Over 65% of users plan to buy, rent, or sell within the next 12 months.
7. Nearly 45% of users are first-time buyers, showing strong demand from new consumers.
8. About 70% of searches focus on single-family residences, followed by condos and co-ops.
Engagement Metrics
Zillow users are highly engaged as they compare home values, track price cuts, and monitor market shifts.
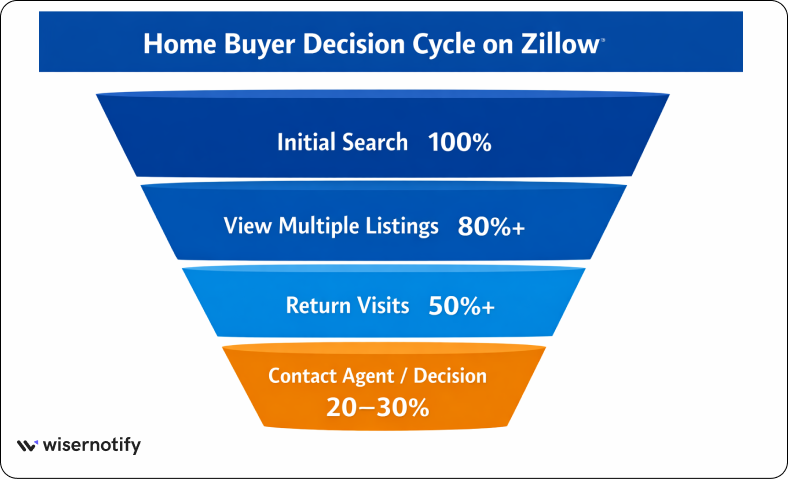
9. Users view 15–20 listings per session, comparing price, housing type, and location.
10. Over 50% of users return multiple times before buying or contacting agents, showing long decision cycles.
11. Listings with a price cut receive up to 2x more views, helping sellers attract buyers faster.
12. Homes are taking longer to sell, with many listings staying active for over 30–40 days in the current market.
Zillow Market Share & Industry Position
Zillow holds a strong position in the online real estate market. It connects buyers, sellers, renters, and real estate professionals on one platform.
The platform reflects real market changes through data like price trends, inventory, and listings. Its wide reach and integrated services make it one of the most used real estate platforms in the U.S.
Zillow vs Competitors
Zillow leads the online real estate space with higher traffic and broader property coverage than competitors.
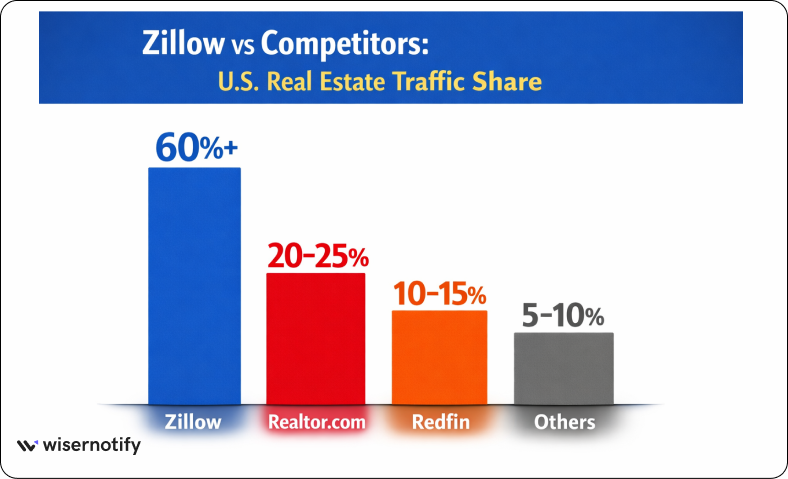
13. Zillow holds over 60% of the traffic share among top real estate websites in the U.S.
14. Zillow gets 2x–3x more monthly traffic than platforms like Realtor.com and Redfin
15. Zillow has data on 135+ million properties, including single-family homes, condo units, and co-ops
Share in the Online Real Estate Market
Zillow dominates the digital housing market with a wide coverage of homes for sale and rental listings.
16. Over 70% of online home shoppers visit Zillow during their buying journey
17. Zillow hosts millions of active listings across homes for sale and rentals
18. The platform updates listing and price data daily across thousands of regions
Zillow’s Ecosystem
Zillow offers a complete ecosystem that supports buying, selling, renting, and financing.
19. Zillow Home Loans handles 3,000+ loan applications per month
20. Over 100 million users connect with real estate professionals on Zillow each year
21. Zestimate uses data from 135+ million properties to estimate home values across regions

All your reviews in one place
Collect reviews, manage every response, and display them where they matter most.
Zillow Revenue & Financial Statistics
Zillow Group earns revenue from multiple real estate services, including agent advertising, rental listings, and Zillow Home Loans.
Its financial performance closely follows housing market trends like home values, inventory, and interest rates.
Annual Revenue Breakdown
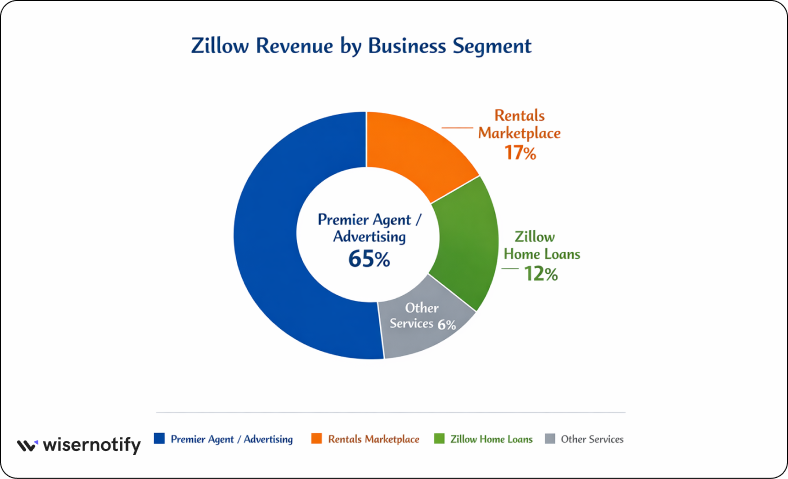
Zillow generates most of its revenue from its Premier Agent network and marketplace services.
22. Zillow reported around $2.1 billion in annual revenue
This shows that Zillow mainly earns by connecting buyers, sellers, and real estate professionals rather than selling properties directly.
Profitability and Growth Trends
Zillow’s profitability depends on changes in the housing market, including price trends, selling activity, and interest rates.
23. Zillow reported a net loss of about $158 million in a recent year
This reflects how shifts in home values, lower transaction volumes, and market risk can impact overall financial performance.
Stock Performance
Zillow’s stock performance reflects investor confidence based on real estate trends, data insights, and platform growth.
24. Zillow stock is trading around $45–$46 per share in 2026
This shows how the company’s valuation is influenced by housing demand, inventory levels, and broader market conditions.
Zillow Listings & Inventory Data
As inventory shifts, it directly impacts home values, selling time, and buyer and seller behavior in the real estate market.
Total Property Listings
Zillow hosts a large number of listings, covering both active homes for sale and rentals across different property types.
25. Zillow tracks over 135 million properties, including owned, off-market, and active listings
26. Around 1.1 million homes are currently listed for sale in the U.S. market
This shows how Zillow gives a full view of available inventory, helping buyers compare options and sellers track competition.
Geographic Distribution
Zillow listings are spread across all regions, but inventory is concentrated more in certain high-demand states and cities.
27. States like Florida, Texas, California, and New York hold a large share of total listings
28. Some regions account for over 15% of active inventory individually, depending on market demand
This distribution reflects how local market conditions, population growth, and housing demand vary by region.
Inventory Trends
Inventory trends on Zillow show how the housing market is changing over time, especially with shifts in interest rates and buyer demand.
29. Housing inventory is up about 6% year over year, showing more homes entering the market
30. Homes are taking around 35–40 days to sell on average, meaning listings are staying active longer
These trends indicate a slower market, where buyers have more choices and sellers may need to adjust p or expectations.
Zillow Housing Market Trends
Zillow housing data shows clear market trends across home values, rent, inventory, and buyer activity.
These trends reflect how interest rates, price changes, and supply levels are shaping the real estate market in 2026.
Buyers now have more choices, while sellers are adjusting their pricing and expectations amid slower demand and longer selling cycles.
Home Price Trends
Zillow tracks home price changes using the Zillow Home Value Index, which reflects the typical home value across housing types, including single-family homes, condos, and co-ops.
31. The typical home value is around $360,000, with only +0.2% year-over-year growth
32. About 22% of listings have a price cut, showing sellers are adjusting to lower demand
This shows that home values are stable but not growing fast, and pricing pressure is increasing in many regions.
Rental Market Insights
Zillow also tracks rent trends across rental listings, giving a clear view of demand from renters and housing affordability.
33. The average rent is around $1,895, growing about +1.9% year over year
34. Rental demand remains steady, with millions of active rental listings on the platform
This indicates that while home buying has slowed, the rental market continues to grow at a steady pace.
Buyer & Seller Behaviour
Zillow data highlights how buyers and sellers are reacting to current market conditions like interest rates and inventory levels.
36. Only about 22% of homes sell above list price, compared to over 50% during peak demand
This shows a clear shift in the market, with buyers having more power and sellers needing to price competitively to close deals.
All your reviews in one place
Collect reviews, manage every response, and display them where they matter most.
Zillow Consumer Behavior Insights
Zillow gives clear insights into how consumers search, compare, and decide on homes.
Users explore Zillow homes, rental listings, and different housing types like single-family residences, condo units, and co-ops while tracking home values, price changes, and market trends.
How Users Search for Homes
Zillow users actively search based on price, location, and housing type. Most users compare multiple listings before taking action.
35. Users view an average of 15–20 listings per session while comparing price, home types, and features
36. Over 70% of searches happen on mobile devices, showing strong app-based browsing behavior
This shows that users rely heavily on Zillow for quick and repeated property searches.
Decision-Making Trends
Zillow users take time before making a decision. They track home values, price cuts, and market changes before contacting agents or making offers.
37. Over 50% of users return multiple times before making a decision
38. Homes with a price cut get up to 2x more views, influencing buyer interest and final decisions
This indicates that buyers are more cautious and data-driven in the current market.
Popular Features
Zillow offers tools and features that help users track listings, estimate value, and stay updated on market changes.
39. More than 40% of users use saved homes and alerts, which drive repeat visits
40. Zestimate uses data from 135+ million properties to provide instant home value estimates
These features help consumers track prices, compare listings, and stay updated, making Zillow a key platform for buying, renting, and selling decisions.
Future of Zillow & Real Estate Data
Zillow is growing from a simple listings website into a full real estate data platform.
It now connects home values, rental data, listings, financing, and user behavior in one place. The focus is shifting toward better predictions, smarter search, and more personalized insights for buyers and sellers.
Emerging Trends
Real estate data is becoming more action-driven. Buyers and sellers now rely on real-time signals such as price changes, inventory levels, and local trends when making decisions.
41. The typical U.S. home value is around $360,000, showing very slow growth
42. Housing inventory is about 1.11 million homes, up ~6% year over year
This shows a slower market where pricing, timing, and local data matter more than before.
Zillow’s Strategic Direction
Zillow is building a connected ecosystem that covers the full real estate journey, from search to financing.
43. Zillow’s database includes 135+ million properties across different home types
This large data layer helps Zillow improve home value estimates, search accuracy, and insights across single-family homes, condos, and co-ops.
Predictions for the Housing Market
The housing market is moving toward steady, slower growth rather than sharp price increases.
44. Home values are expected to grow by about +1.2% in 2026
45. Rent growth is expected to stay low at around +0.3%
This suggests a more balanced market where buyers have more choice, sellers adjust pricing, and growth depends more on each region.
All your reviews in one place
Collect reviews, manage every response, and display them where they matter most.
Conclusion
Zillow statistics show how the real estate market is shifting in 2026. Home values are stable, inventory is rising, and buyers now have more control. Price cuts and longer selling times reflect a more balanced market.
Data like the Zillow Home Value Index, listings, and rent trends help buyers, sellers, and renters make better decisions.
As the market changes, Zillow remains a key platform for tracking home values, listings, and real estate trends.
